How to find powered land for data centers with AI
2.76 million circuit segments, read so an investor could ask which buildings have power.

Brennen Fountain
Powered land is a site where enough electrical capacity is already available, so a data center or other high-load user can connect without waiting years in an interconnection queue. Finding it means combining substations and their voltage, transmission lines, which utility serves the site, the utility's hosting capacity for each distribution circuit, and how much power existing buildings already use. An AI assistant such as Claude or ChatGPT can screen sites against those layers once they are in one place, but it cannot assemble millions of utility records on its own.
A powered-land investor in California was building a model to find existing industrial buildings that could be converted for data centers and other high-load use. The first question was simple to say:
Show improved commercial and industrial parcels over 30,000 building square feet within one mile of a substation of 69 kV or higher, with the distance and the voltage for each.
The problem: the power data is in a dozen places
New data centers often wait years for a grid connection. That makes power that is already in place valuable: an industrial building with heavy electrical service, near a substation with room to spare, can be worth far more to a high-load user than to a warehouse tenant.
Distance to a substation is only the first cut. Whether power is really available depends on the substation's voltage, how much headroom the local distribution circuit has, which utility serves the site, and how much power the building already draws. Each of those comes from a different publisher. Utilities post hosting capacity in their own map viewers, one circuit at a time. Substations and transmission lines come from federal datasets, service territories from the state, building energy use from the state's benchmarking program, and plant retirements from the U.S. Energy Information Administration.
Checking one building by hand means visiting each of those sources and lining them up. At even half an hour a building, a short list of 1,000 candidates is 500 hours of work, and the circuit-level data alone runs to millions of records.
The result: California's grid, ready to screen against
The investor ended up with every layer the model needed, in one place and queryable together:
- 2,763,267 distribution circuit segments with hosting capacity, from PG&E (2,086,800) and Southern California Edison (676,467)
- 77,946 substations and grid facilities and 94,619 transmission line segments
- 54 California electric utility service territories
- 25,591 building energy disclosures from the state's benchmarking program
- federal records on 16,933 power plants, with their generators, planned additions, and retirements
The first grid layers were ready in a little over a day, and follow-up requests for more grid data came back in 8 to 9 hours. The building energy data took 11 days and the full federal plant records about five weeks, and the model grew as each layer landed.
With all of it together, the investor could ask the question the model was built for: which large buildings sit near a high-voltage substation, on a circuit with headroom, in the right utility's territory, and report low energy use for their size.
Why an AI assistant can't do this on its own
AI assistants like Claude and ChatGPT increasingly work as agents: you give one a task in plain English and it researches, analyzes, and comes back with an answer. Hand one a table of buildings with grid data attached and it can rank them well. Collecting that grid data is where it stops.
Ask an assistant which California buildings have power available and it will search the web and find news stories, a utility's map page, maybe a federal download link. It cannot pull two million circuit segments out of a utility's map viewer, it cannot hold them in a conversation, and it has no way to line them up with substations, territories, and building energy use. It also starts from zero every time you ask.
How it was done: Ploti
The investor used Ploti, the real estate data layer for AI. Ploti's data agents fetch and compile public records, from county and city systems to utility and federal sources, and store them so an AI agent can query all of it. For this request they collected each utility's hosting capacity map, the federal substation, transmission, and power plant records, the state's service territories, and its building energy disclosures, and kept every record tied to its source.
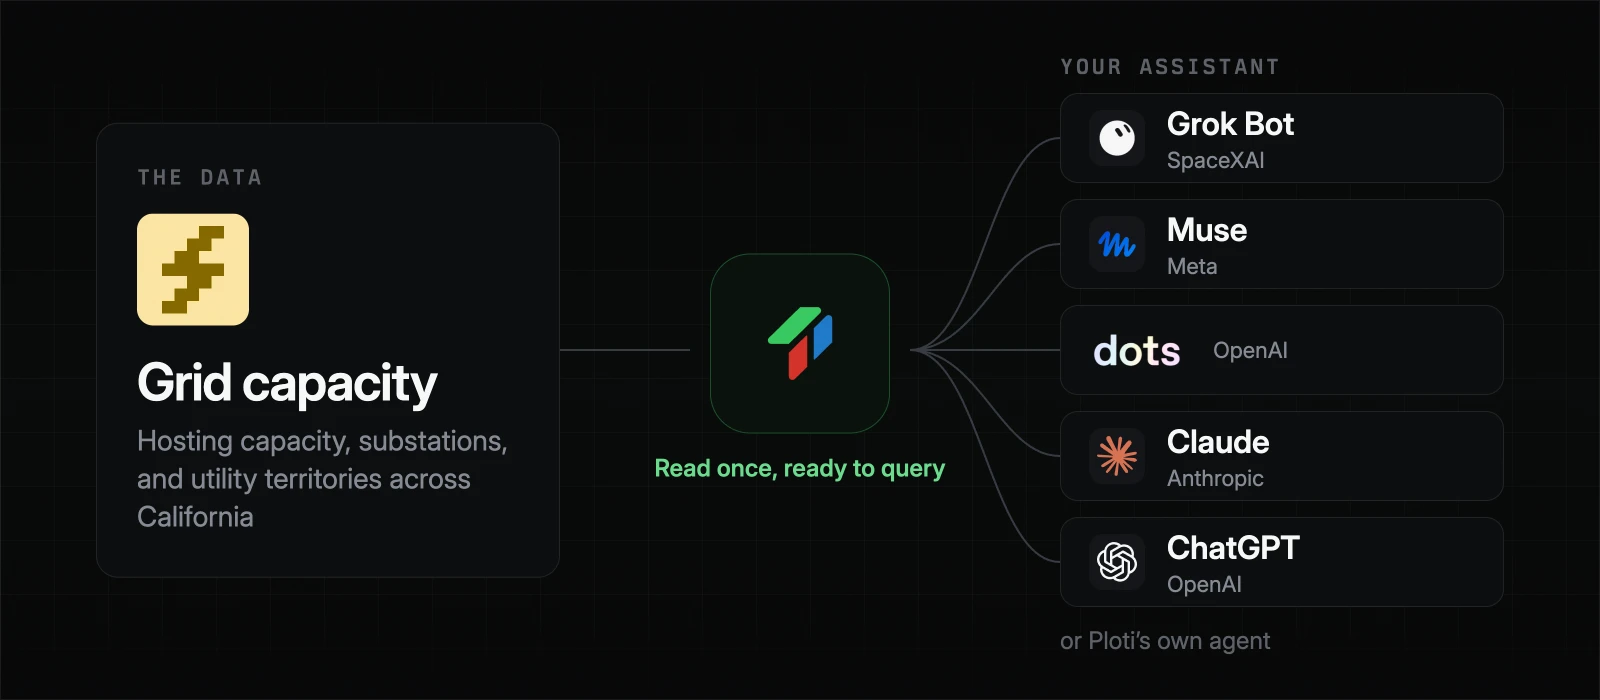
Each source was fetched once and stays ready. The investor's assistant can run the whole screen across all 2.76 million circuit segments whenever the model changes, or check a single building in seconds, through an MCP connector in Claude or ChatGPT or through Ploti's own agent.
Utility map viewers are built for clicking through one circuit at a time, and Ploti's agents work through them the same way they work through permit portals and meeting archives. When a record is not published at all, Ploti can email the agency that holds it and handle the exchange.
Why not buy grid data from a data provider
Grid and power-siting data is sold by specialist providers, usually on annual contracts negotiated through sales, often in the tens of thousands of dollars, with access limited by seats or exports. For an investor testing a thesis in one region, that is a large commitment before the first building is scored.
Ploti works differently:
- No contract. Sign up and start with a 7-day trial.
- Pay for the places you work. Pricing is per county, starting at $50 a month, so a handful of target counties costs tens or hundreds of dollars a month.
- Full access to every layer. Your assistant can query every circuit segment, substation, and building disclosure in your coverage areas, not a set number of lookups.
- It builds up over time. Ploti keeps collecting data in your counties on its own, so the parcels, zoning, and permits you need next are often already there.
What else it unlocks
The same grid layers support more than one strategy:
- Retiring plants. Power plants scheduled to retire leave behind transmission-scale connections, and the federal records show where and when.
- Utility boundaries. Compare similar buildings on either side of a service territory line to see where the serving utility changes the value.
- Underused buildings. Pair reported energy use with the nearest circuit's capacity to find large buildings that draw little power on a grid that has room.
Paired with parcels, zoning, and permits in the same counties (everything Ploti maintains in your coverage areas), the screen can go from "where is the power" to "which of these buildings could actually be converted". For the bigger picture, see what a real estate data layer for AI is. If your model needs a source Ploti does not have yet, file a data request.
Frequently asked questions
What is hosting capacity?
The amount of new load or generation a stretch of distribution circuit can take without upgrades. Utilities such as PG&E and Southern California Edison publish it by circuit segment, usually on their own map viewers.
Where can I find grid capacity data for a site?
From several public sources: utility hosting capacity maps, federal substation and transmission line datasets, state maps of utility service territories, and the U.S. Energy Information Administration's records of power plants and retirements.
Why does it matter which utility serves a site?
Interconnection rules and timelines differ from utility to utility, so two similar buildings on either side of a service territory line can be very different assets for a high-load user.
Can an AI assistant check grid capacity for a site?
Yes, once it can query the grid data. Connect Claude, ChatGPT, or another assistant to Ploti with an MCP connector and ask about substations, hosting capacity, and the serving utility for any site, or ask Ploti's own agent.
How you can do it yourself
If you already use an assistant, connect Ploti and run your own power screen. Setup takes about two minutes for Claude, ChatGPT, Gemini, Claude Code, Codex, and Cursor, and works with any assistant that supports MCP connectors. Then ask things like:
- "Which industrial buildings over 30,000 square feet are within a mile of a 69 kV or higher substation in my counties?"
- "For this site, what is the load hosting capacity on the nearest circuit, and which utility serves it?"
- "Which power plants within 20 miles are scheduled to retire in the next five years?"
If you don't use an assistant, ask Ploti's agent on the web, in the Mac or Windows app, or soon on your phone. Pick the counties you work in and start a 7-day trial.