Ploti Enterprise

Turn your company data into answers

Upload the data only your team has. Ploti connects it to your geospatial workspace so anyone can ask questions, generate maps and dashboards, and move decisions forward.

Talk to sales
Margin dashboard
Community map
Plan variance
Margin dashboardCommunity margin performance
Generated from private ERP, sales, land pipeline, and community location data
Active communities24Across four markets
Avg gross margin24.8%+1.6 pts vs plan
YTD closings18692% of plan
Gross marginBy market
Austin28.4%
Dallas25.9%
Houston23.7%
San Antonio21.8%
ClosingsMarket mix
186YTD closings
AustinDallasHouston
Private data analysisCommunity performance

1 Joined ERP margin and closings to each community location.

2 Compared actual gross margin and closings against plan by market.

3 Plan variance and views for later access.

Your business data should work alongside every map

Company data usually lives across CRMs, warehouse tables, spreadsheets, operating systems, and local files. The context needed to answer a question is split before the work even begins.

Ploti gives enterprise teams one private context layer where internal records and geospatial intelligence can be understood together by people and agents.

Company systems
CRM and pipeline
Warehouse tables
Spreadsheets and files
Private contextPloti

Schema · location · relationships · permissions

Team outputs
Live maps
Custom dashboards
Records and artifacts
01

One context layer for company and map data

Internal operating data and maintained geospatial sources live in the same workspace, with the relationships between them preserved.

02

Questions become reusable work

Every answer can become a dashboard, map, artifact, or saved record view that the rest of the team can continue using.

03

Your data stays company-specific

Private datasets are connected to your workspace so Ploti can reason with the context only your organization has.

Move at the speed of your data
without rebuilding the analysis

Ploti turns private company context into the same maps, dashboards, records, and agent workflows your team already uses.

See private business data in geographic context

Connect company locations, customers, assets, pipeline, revenue, and operating metrics to the parcels, markets, infrastructure, and local signals around them.
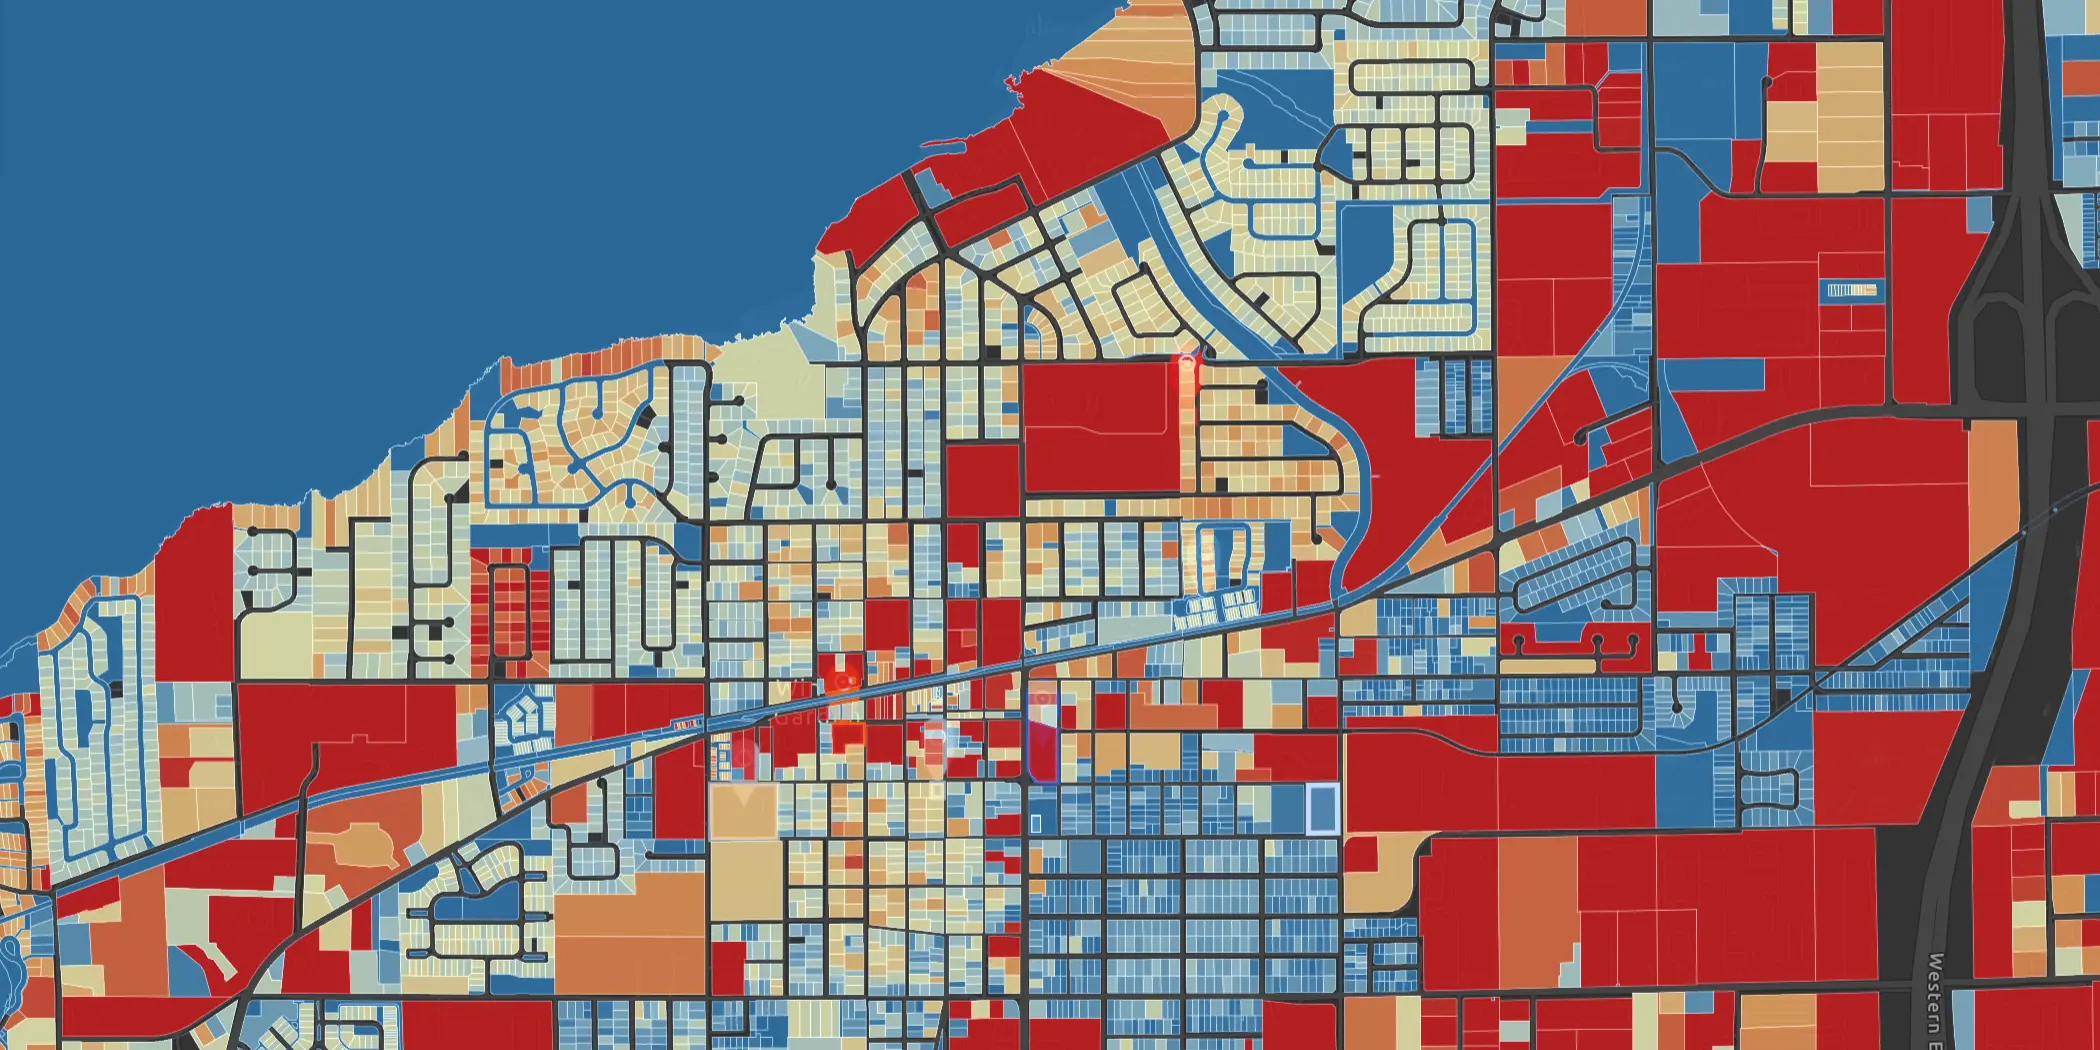
Ploti parcel value heatmap on an interactive map
PPloti chatMap workspace
Brennen
Brennen

Show revenue, pipeline, and asset performance by market, then explain the local signals behind the differences.

Ploti

I joined your private performance data to the map so the strongest and weakest markets stand out immediately.

Portfolio performance by market
12,480 company records

Private operating metrics joined to geographic context, with the strongest markets highlighted for follow-up analysis.

Now isolate the markets where internal demand is rising faster than local supply.
Ploti parcel value heatmap on an interactive map
Explore company performance on the map

See private business metrics in place, then ask Ploti to isolate the markets, assets, and opportunities that matter.

Ask questions across private and geospatial data

The Agent Harness reasons across your CRM, warehouse, spreadsheets, records, and geospatial layers, then builds the exact dashboard, map, or artifact your team needs.

Enterprise performance scorecard
Market performance map
Operating drivers
OpenUI dashboardPortfolio performance by market
Generated from private pipeline, revenue, asset, parcel, and market data
Priority markets18+6 since last pull
Avg performance82%Hays leads Travis
Data confidence94%12 maintained sources
Performance scoreBy county
Hays86
Travis82
Williamson74
Comal69
DriversSignal mix
42%company + market
Company dataUtilitiesZoning
Query provenanceAgent harness steps

1 Joined parcel centroids to current zoning overlays.

2 Weighted internal performance, pipeline, customer demand, and local market conditions.

3 Rendered dashboard tab and linked map artifacts.

PPloti chatOrchestrator
Brennen
Brennen

Which markets are outperforming once our private pipeline, customer demand, asset performance, and local market conditions are weighted together?

Ploti

I built a private performance dashboard, opened the source map, and linked every result back to the company and market records behind it.

Created dashboard

Portfolio performance by market

Open tabs

Dashboard / Map / Artifact

Sources

CRM pipeline, revenue, assets, company locations, parcels, and market signals

Compare internal demand and local supply across the top five markets.
DashboardMapArtifact
Enterprise performance

Ploti rendered a dashboard from private company data and maintained geospatial sources.

Keep company records connected to every answer

Define the customers, assets, opportunities, sites, projects, and internal objects your business tracks. Ploti can read and update those records while answering questions across the workspace.

Sourcing12
REC-2085
East Riverside assemblage
OwnerParcel
REC-2094
SH-130 frontage tract
Traffic
REC-2092
FM 1626 infill sites
Utility
REC-2200
Loop 1604 interchange
Zoning
Qualified8
REC-926
Kyle Parkway retail pad
Priority ASite
REC-2088
Round Rock utility corridor
PowerFiber
REC-2214
Cedar Park ownership match
Owner
Diligence5
REC-1433
San Marcos mixed-use site
Permit
REC-1441
Comal expansion area
FloodRisk
REC-1519
Buda drainage review
Infra
Live18
REC-1712
Austin entitlement tracker
Watch
REC-1788
Williamson permit monitor
Permit
REC-1810
Utility service territory
Utility
RecordsEnterprise operating records

Saved views keep company records, decisions, owners, and next steps connected to every Ploti analysis.

Built around the data your company already owns

Start with the systems that contain the most decision-critical context, then shape Ploti around your operating model.

Connect

Bring CSVs, warehouse tables, CRM exports, databases, and internal APIs into one private workspace.

Model

Map fields, locations, joins, record types, and operating definitions around the way your company works.

Govern

Keep source context, workspace access, and the records behind each answer visible to the people using it.

Onboard

Work with the Ploti team to connect priority sources and establish the first high-value questions and workflows.

Contact sales

  • Connect proprietary company data
  • Define your highest-value questions
  • Get hands-on onboarding support

Tell us about your team and your data.

Share the systems you want to connect, the regions that matter, and the questions your team needs answered faster.


Which states do you work in?

You can also email us at team@ploti.ai