The Opportunity
Traffic analysis helps you:- Identify high-visibility locations on the busiest corridors
- Compare sites objectively using actual traffic counts
- Classify roads into tiers by traffic volume
- Rank commercial sites by their exposure to potential customers
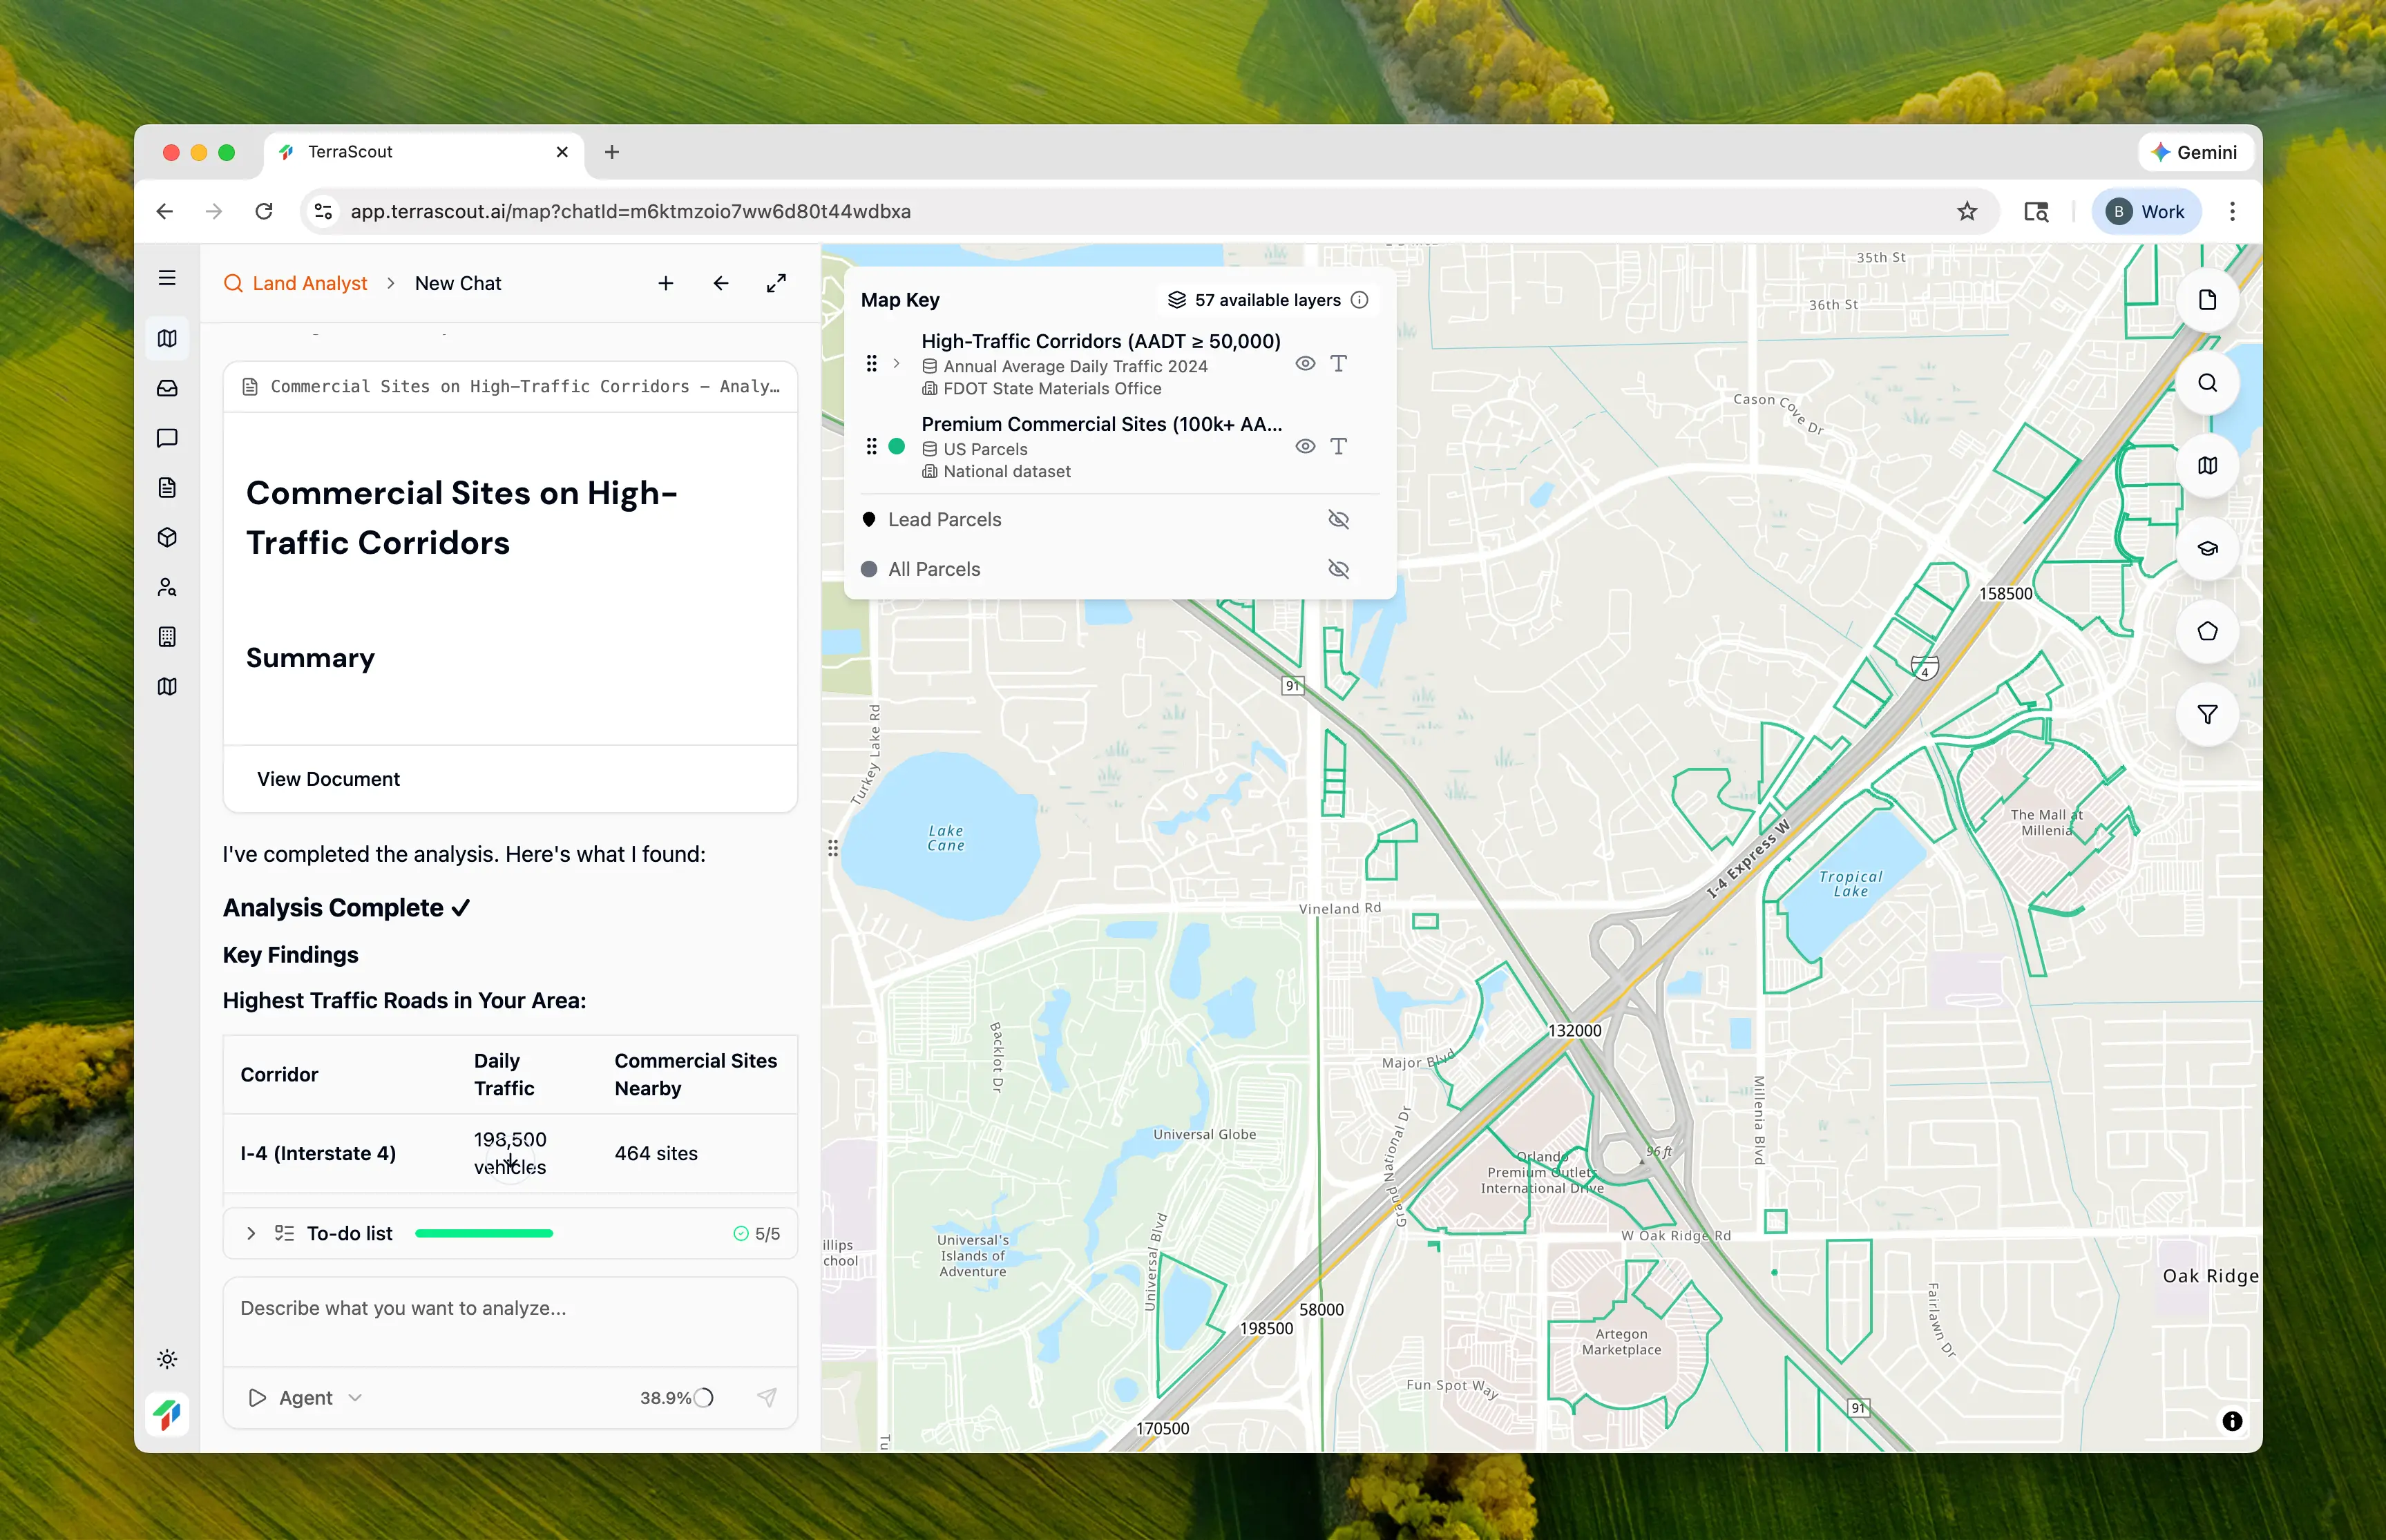
Walkthrough: Finding Commercial Sites on High-Traffic Corridors
Let’s identify the busiest traffic corridors and find commercial sites along them. We want to understand which roads carry the most traffic and rank available sites by their exposure.Step 1: Select Your Search Area
Draw a boundary around your target market. In this example, we drew an area spanning Orlando, Winter Garden, Ocoee, and surrounding areas—capturing major highway corridors and commercial arterials.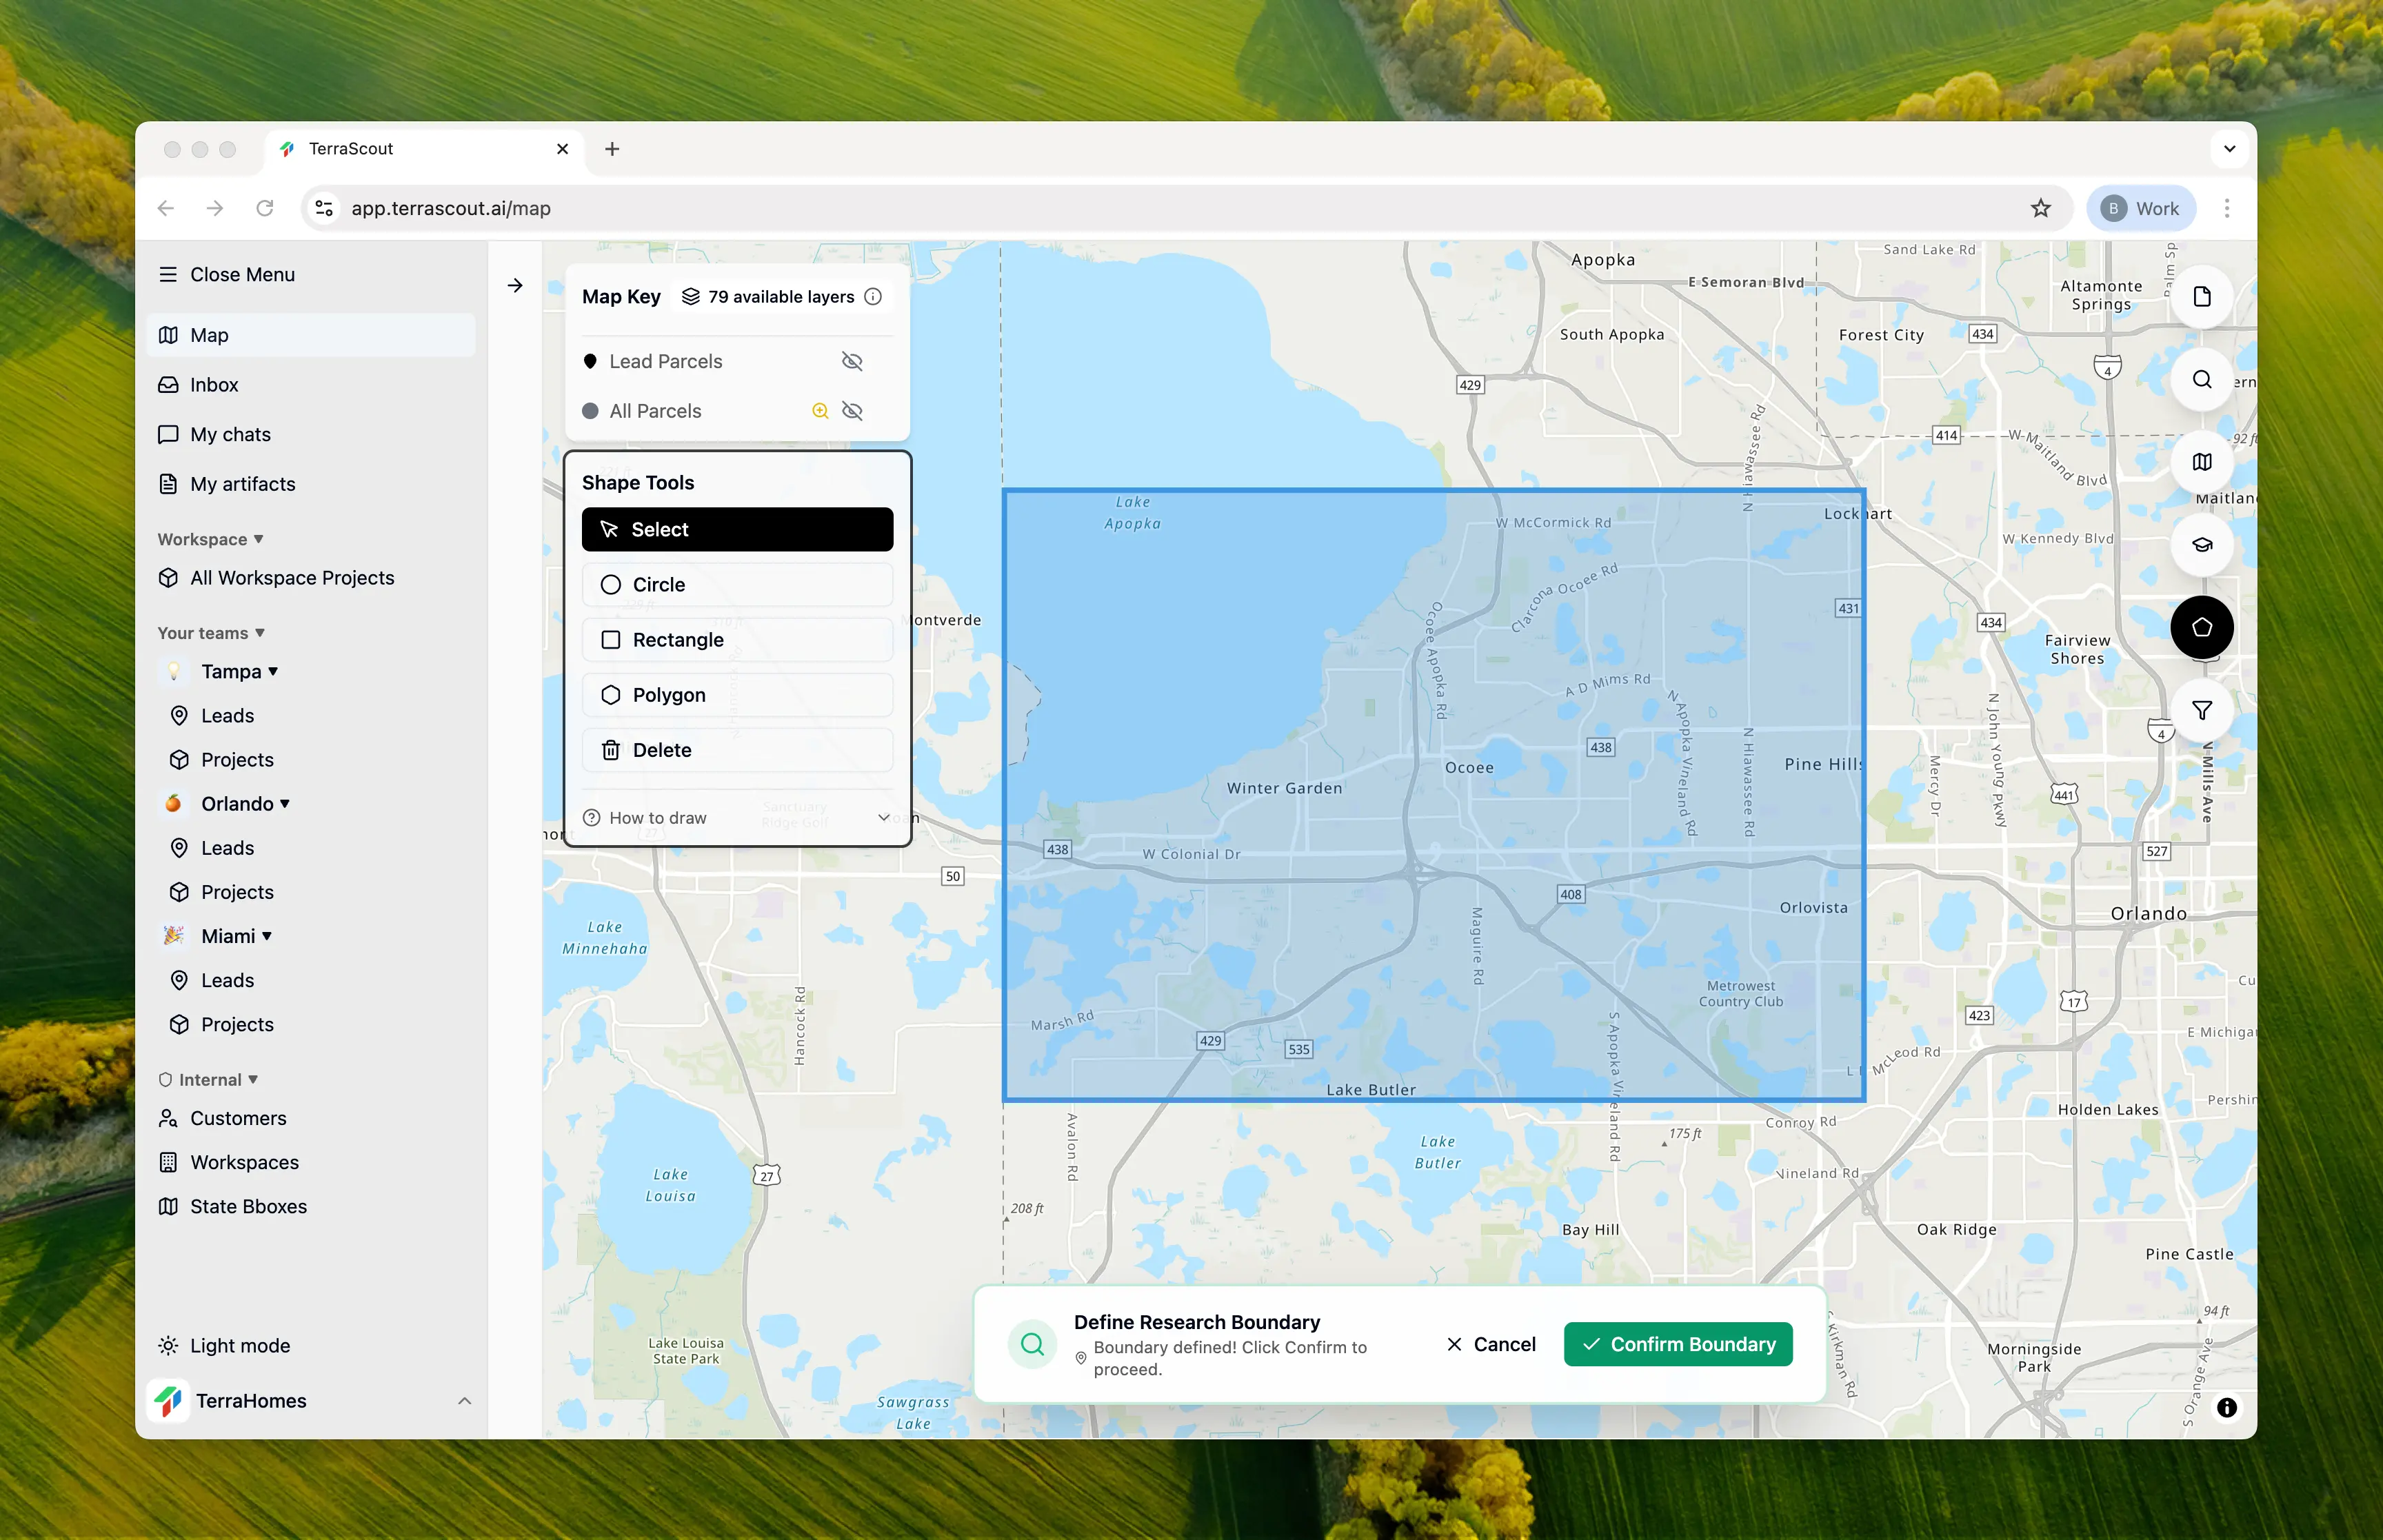
Step 2: Ask the Question
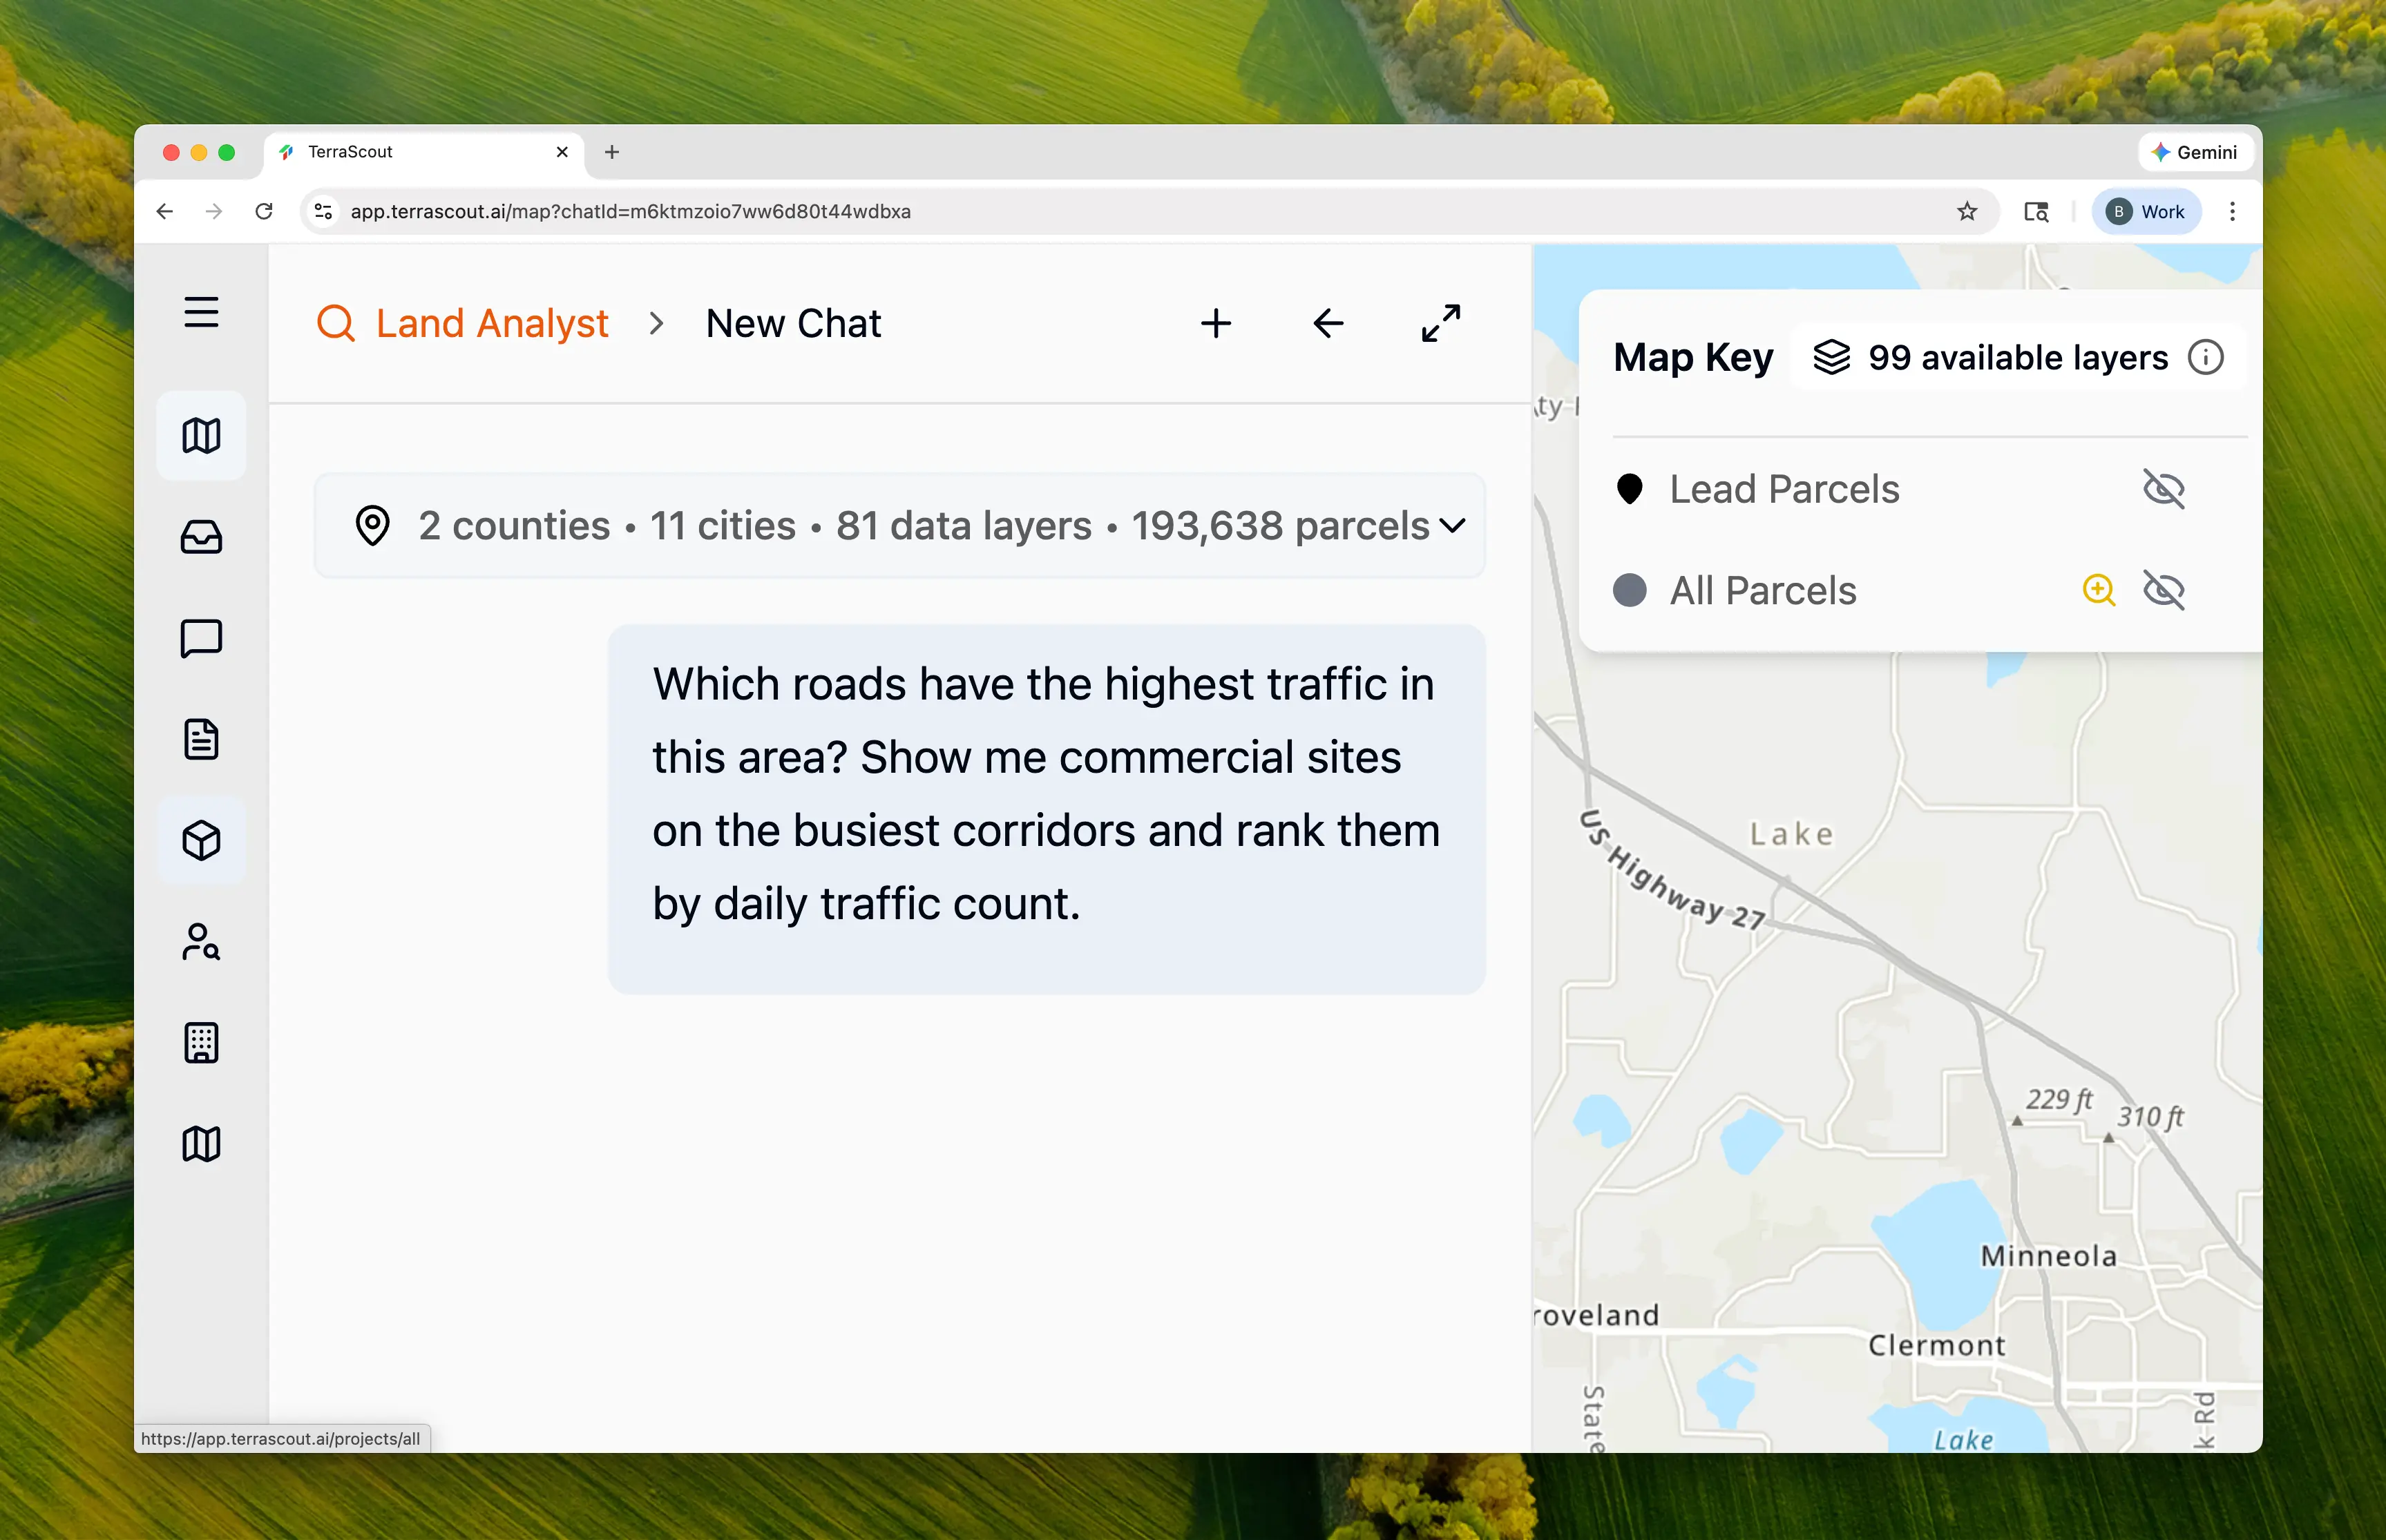
Which roads have the highest traffic in this area? Show me commercial sites on the busiest corridors and rank them by daily traffic count.This triggers a multi-step analysis:
- Traffic corridor identification and ranking
- Commercial parcel filtering
- Spatial join to connect parcels with traffic data
- Ranking by AADT exposure
Step 3: Watch the Discovery
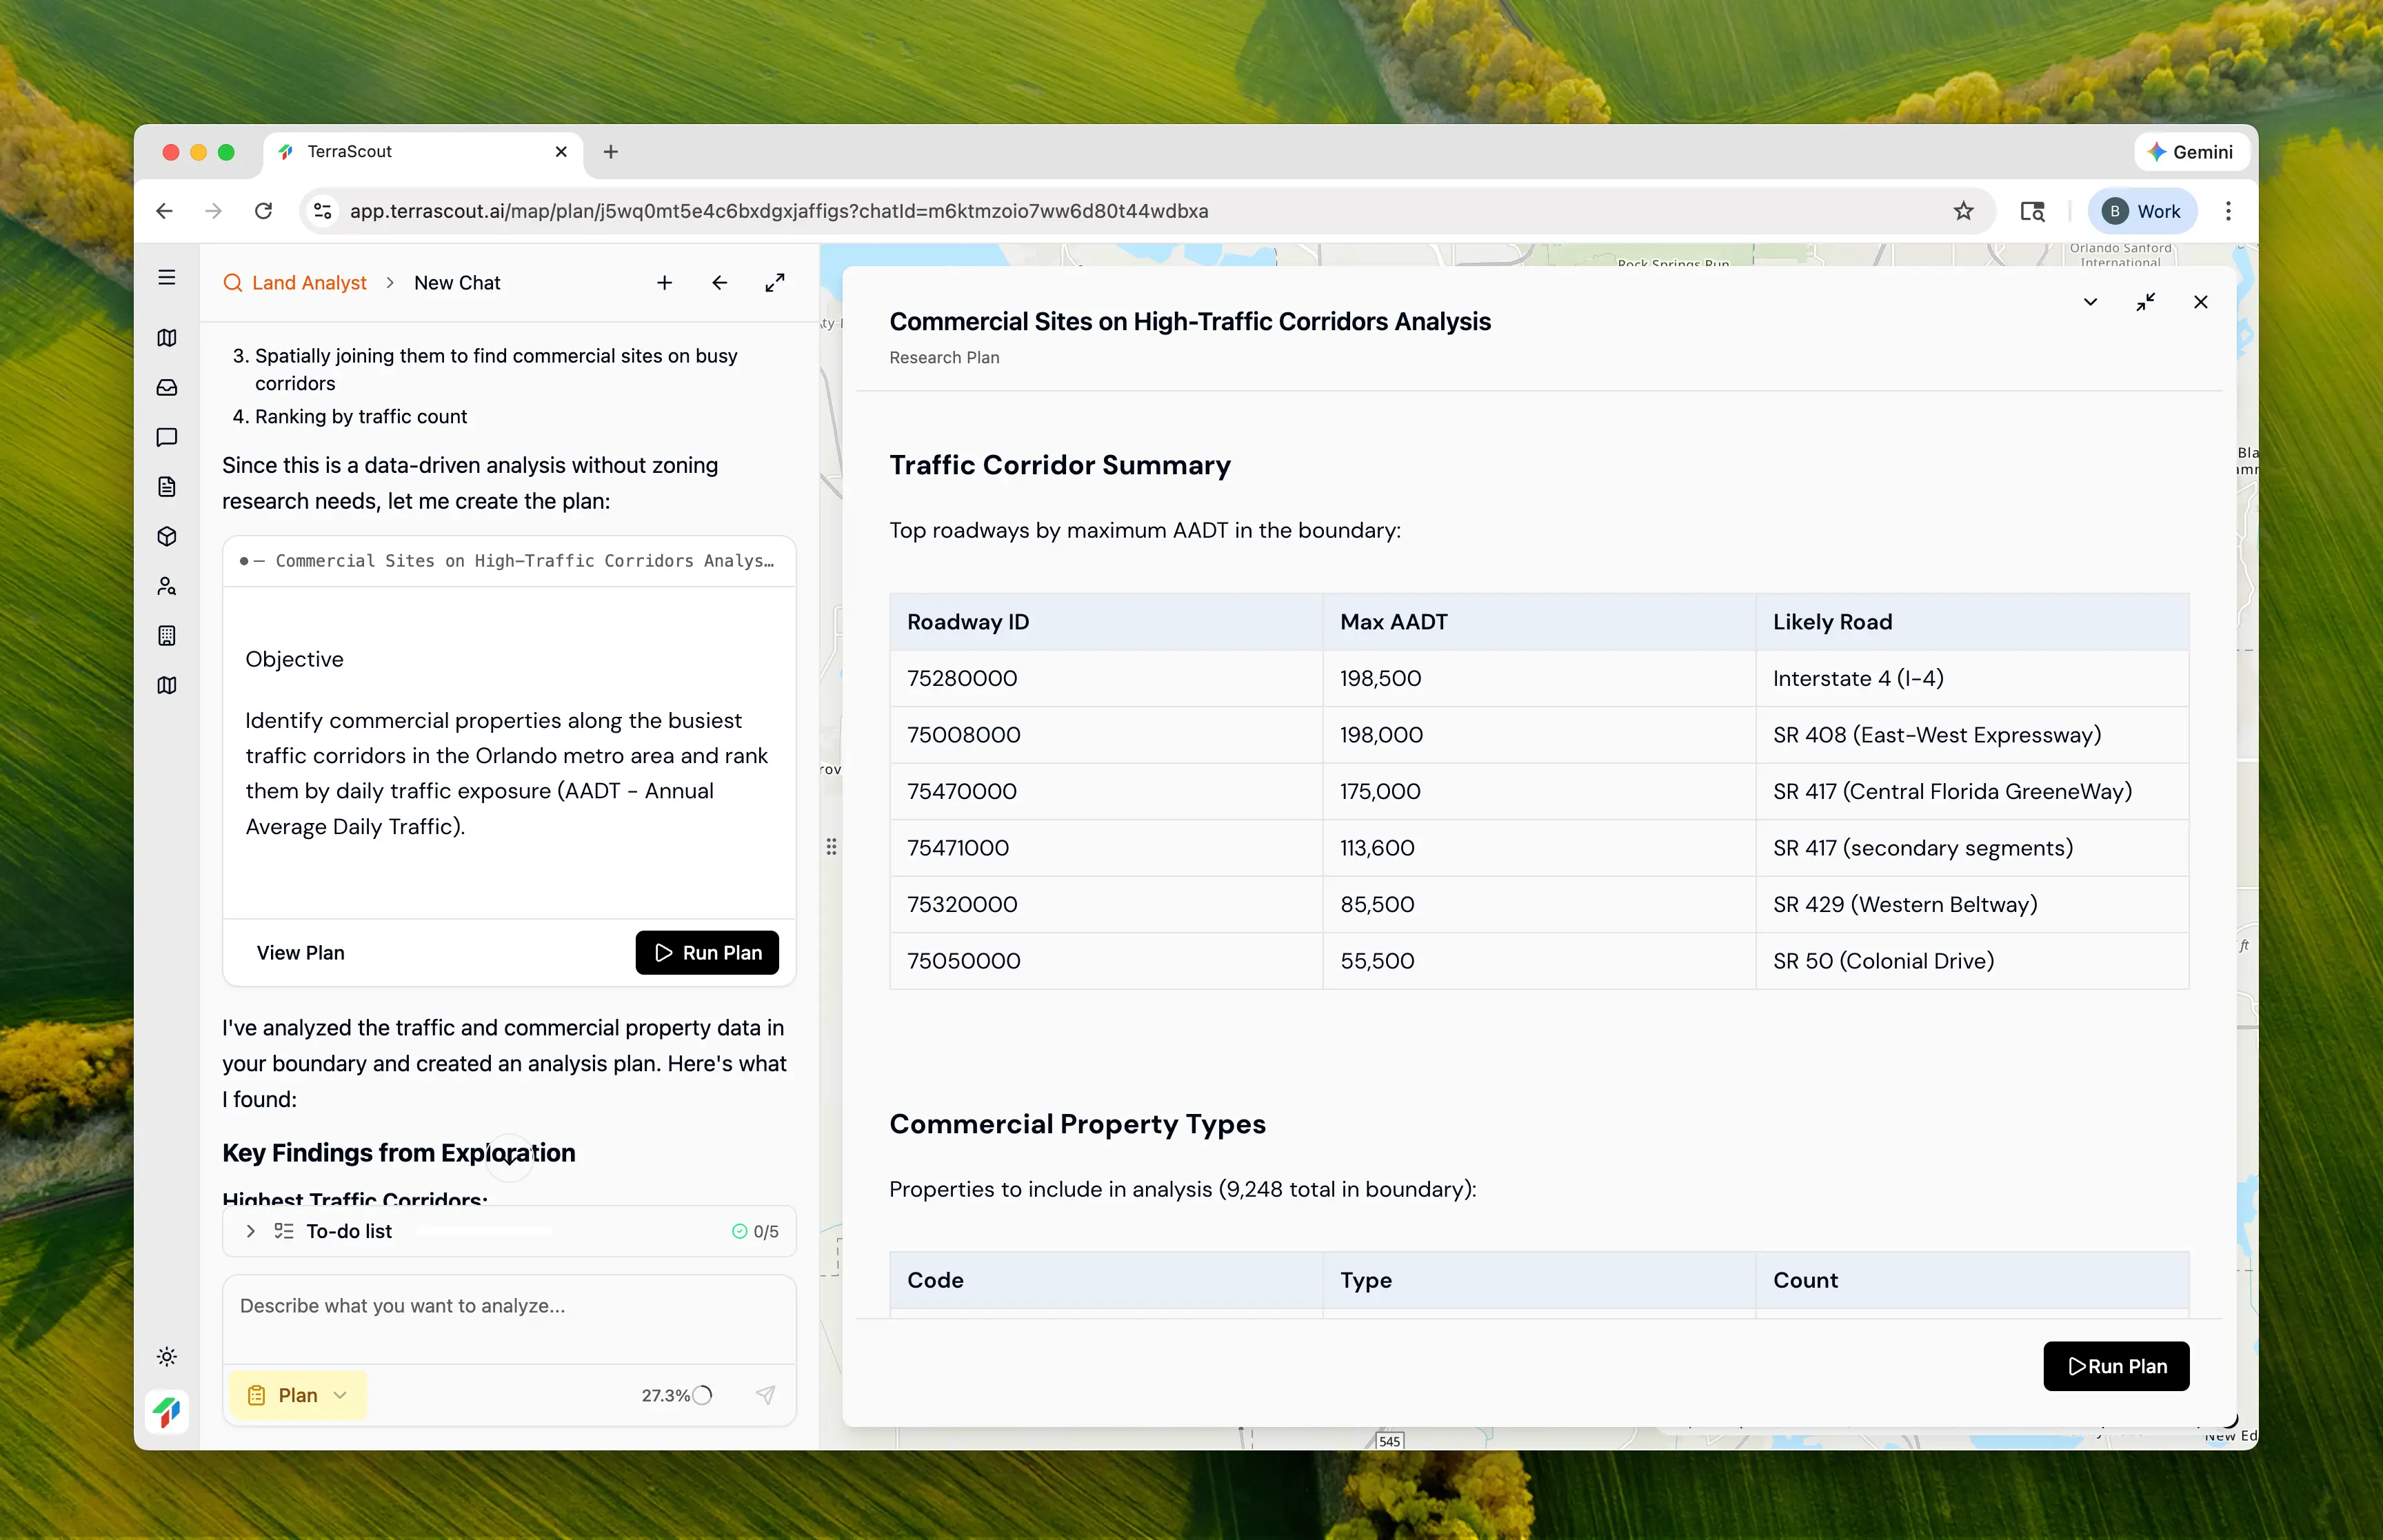
Ploti discovered FDOT AADT data and analyzed traffic patterns: Top Traffic Corridors Identified:| Road | Max Daily Traffic | Description |
|---|---|---|
| I-4 (Interstate 4) | 198,500 | Primary east-west interstate |
| SR 408 (East-West Expressway) | 198,000 | Downtown Orlando toll road |
| SR 417 (GreeneWay) | 175,000 | Eastern beltway |
| SR 429 (Western Beltway) | 85,500 | Western toll road |
| SR 414 (Maitland Blvd) | 79,000 | North Orlando arterial |
| SR 528 (Beachline) | 58,000 | Airport connector |
| SR 50 (Colonial Drive) | 55,500 | Major commercial arterial |
| US 441 (Orange Blossom Trail) | 54,000 | Historic commercial corridor |
| Property Type | Count |
|---|---|
| Commercial Condo | 2,724 |
| Warehouse | 2,135 |
| Retail | 1,997 |
| Office Building | 992 |
| Service | 979 |
| Commercial (General) | 346 |
| Financial Institution | 75 |
| Total | 9,248 |
Step 4: Review the Plan
- Create traffic corridor checkpoint (AADT ≥ 50,000)
- Create commercial parcels checkpoint (all commercial properties)
- Spatial join—find commercial parcels within ~720 ft of high-traffic roads
- Calculate traffic exposure—assign highest nearby AADT to each parcel
- Create ranked checkpoint sorted by traffic count
- FDOT AADT 2024 — Annual Average Daily Traffic for state roads
- US Parcels — Property records with commercial classification codes
Step 5: Run the Analysis
Click Run Plan to execute. Ploti creates tiered checkpoints:| Checkpoint | Count | Description |
|---|---|---|
| High-Traffic Corridors (50k+ AADT) | 64 | Road segments with 50,000+ daily vehicles |
| Very High-Traffic Corridors (100k+ AADT) | 31 | Premium segments with 100,000+ daily vehicles |
| Commercial Properties | 9,248 | All commercial parcels in boundary |
| Commercial Sites on High-Traffic Corridors | 2,227 | Near 50k+ AADT roads |
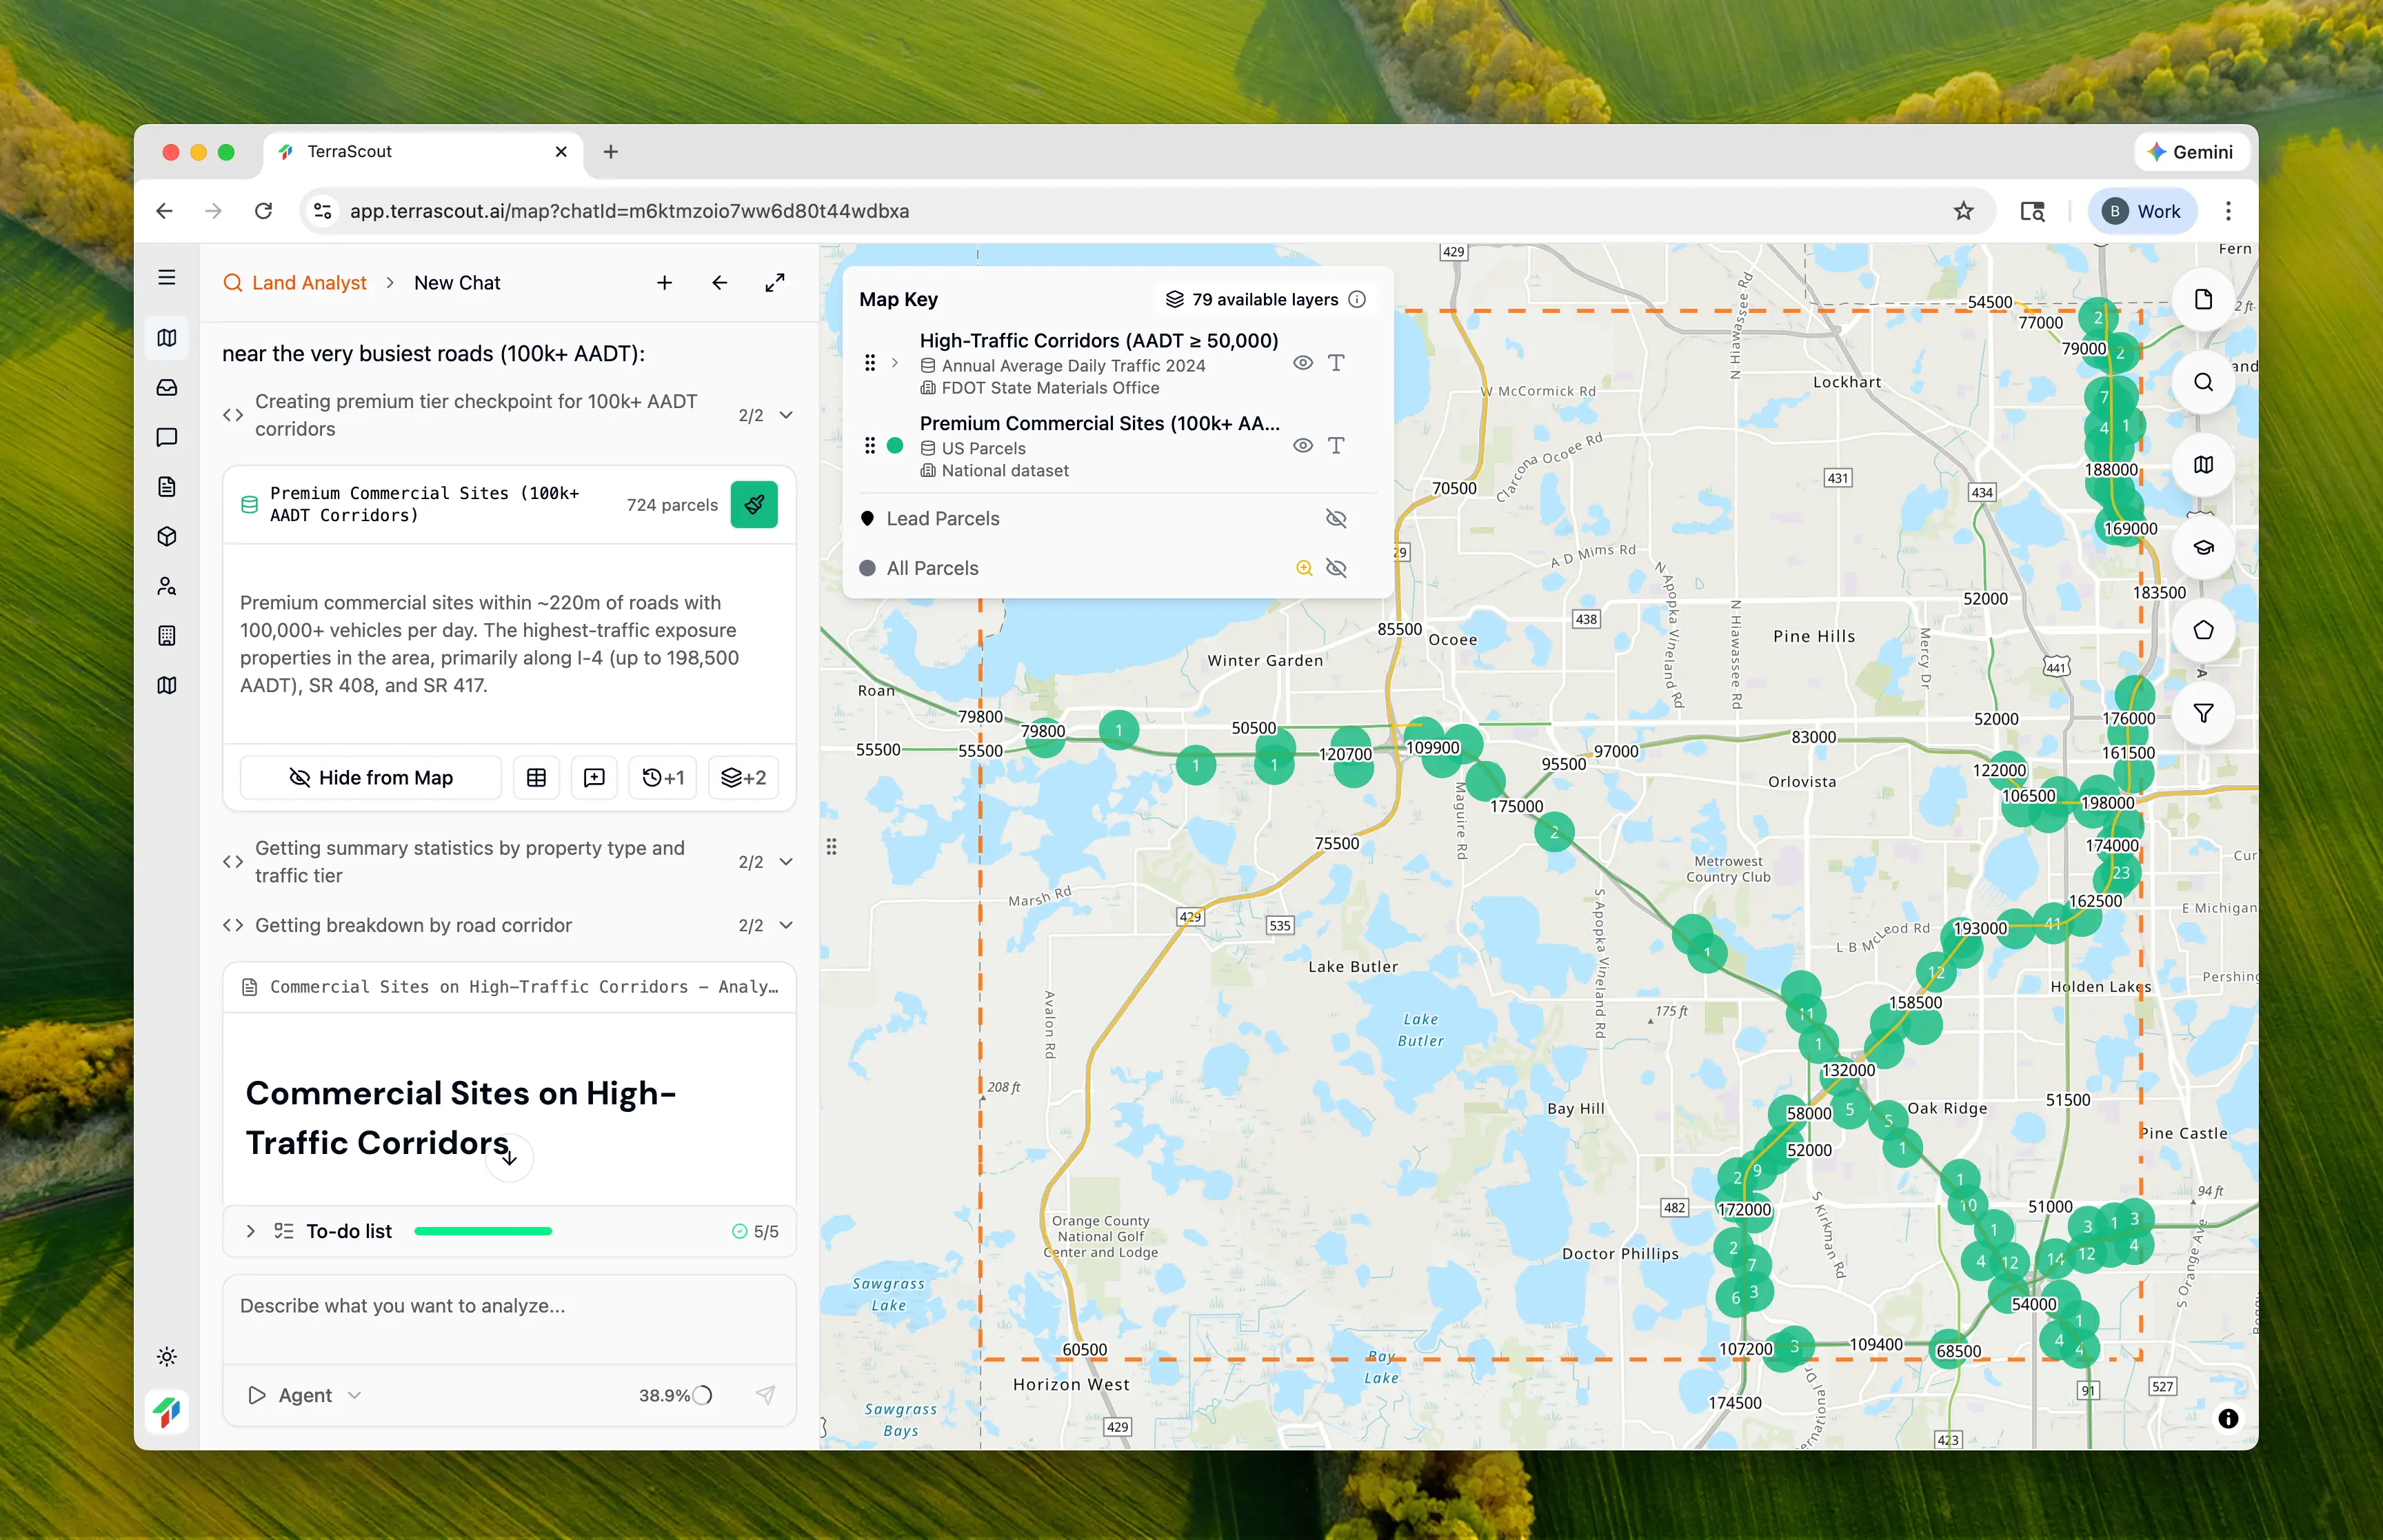
| Premium Commercial Sites | 724 | Near 100k+ AADT roads |
Step 6: Review the Results
| Traffic Level | Sites | Description |
|---|---|---|
| 150,000+ AADT | 484 | Premium highway frontage |
| 100,000-150,000 | 240 | High-volume corridors |
| 75,000-100,000 | 292 | Major arterials |
| 50,000-75,000 | 1,211 | Significant traffic |
| Property Type | 150k+ | 100k-150k | 75k-100k | 50k-75k | Total |
|---|---|---|---|---|---|
| Commercial Condo | 46 | 58 | 16 | 584 | 704 |
| Warehouse | 127 | 84 | 105 | 133 | 449 |
| Retail | 116 | 37 | 59 | 226 | 438 |
| Service | 59 | 25 | 47 | 140 | 271 |
| Office | 108 | 21 | 40 | 73 | 242 |
Step 7: Examine Top-Ranked Sites
| Rank | AADT | Type | Address | City |
|---|---|---|---|---|
| 1 | 198,500 | Commercial | W Oak Ridge Rd | Orlando |
| 2 | 198,500 | Commercial | Universal Blvd | Orlando |
| 3 | 198,500 | Commercial | 4949 International Dr | Orlando |
| 4 | 198,500 | Commercial | 4967 International Dr | Orlando |
| 5 | 198,500 | Retail | 5725 Major Blvd | Orlando |
| 6 | 198,000 | Warehouse | 724 Franklin Ln | Orlando |
| 7 | 198,000 | Retail | 711 S Parramore Ave | Orlando |
| 8 | 198,000 | Warehouse | 713 Franklin Ln | Orlando |
| 9 | 198,000 | Retail | 102 W America St | Orlando |
| 10 | 198,000 | Office | 80 S Lucerne Cir W | Orlando |
Step 8: Understand the Corridors
The analysis revealed distinct corridor profiles:| Corridor | Character | Best For |
|---|---|---|
| I-4 / International Dr | Tourism, high visibility | Hotels, attractions, national retail |
| SR 408 / Downtown | Urban core, office workers | Restaurants, services, professional |
| SR 50 (Colonial Drive) | Commercial arterial | Auto-oriented retail, services |
| US 441 (OBT) | Historic commercial strip | Value retail, auto services |
| SR 417/429 | Suburban beltway | Limited access, less retail-friendly |
Why This Matters
This analysis demonstrates traffic-based site ranking:- Corridor identification — Found and ranked roads by actual AADT data
- Tiered classification — Grouped sites by traffic exposure (150k+, 100k+, 75k+, 50k+)
- Spatial joining — Connected parcels to nearby traffic counts
- Quantified exposure — Each site has an objective traffic number
- Property type breakdown — Understand what’s available at each tier
- Obtaining FDOT traffic count data
- Mapping road segments geographically
- Filtering commercial parcels from property records
- Performing spatial joins between parcels and roads
- Ranking and categorizing results
Taking It Further
With traffic tiers established, you can refine further:Which premium sites (100k+ AADT) are retail properties under 2 acres?Find high-traffic pad site opportunities.
Show me commercial sites on SR 50 that are currently vacantFocus on a specific corridor with available inventory.
Compare traffic on International Drive vs Colonial DriveUnderstand corridor differences for site selection.
Which high-traffic sites are NOT near highway on-ramps?Filter for arterial frontage vs limited-access highway adjacency.
Key Insights
Why AADT Matters for Retail
AADT (Annual Average Daily Traffic) measures:- Exposure — How many potential customers see your location daily
- Market validation — High traffic indicates economic activity
- Comparable basis — Objective metric to compare sites
- 50,000+ AADT = Major arterial, strong retail potential
- 100,000+ AADT = Premium corridor, national retailer interest
- 150,000+ AADT = Highway-level traffic, maximum exposure
Traffic ≠ Access
High AADT doesn’t guarantee good retail sites:- Highways have traffic but limited access (SR 417, SR 429)
- Speed matters — 70 mph traffic can’t stop easily
- Medians may prevent left turns
- Frontage roads provide the access, not the highway itself
The I-4 / SR 408 Premium
Sites near I-4 and SR 408 have the highest traffic exposure (198,000+ AADT), but they’re also:- Most expensive
- Most competitive
- Often already developed
Tips
- Toggle the traffic layer — Visualize which roads carry the most vehicles
- Check access points — High AADT means nothing without ingress/egress
- Consider speed — Slower arterials (35-45 mph) are better for retail than 65 mph highways
- Look at both directions — Morning vs evening commute patterns matter
- Premium isn’t always best — 75,000 AADT with good access beats 150,000 with limited access
- Verify frontage — “Near” a highway isn’t the same as “visible from” a highway
Other Example Prompts
Specific Traffic Threshold
Find commercial sites on roads with at least 30,000 vehicles per day for a neighborhood retail centerLower threshold for local-serving retail.
Traffic Growth
Which corridors have seen traffic increases in the last 5 years? Show me commercial sites in growing areas.Identify emerging markets.
Arterial vs Highway
Find retail sites on arterial roads (not limited-access highways) with 40,000+ daily trafficFocus on accessible corridors.
Traffic + Vacancy
Show me vacant commercial parcels on roads with 50,000+ AADTCombine traffic analysis with availability.
Commute Direction
Find commercial sites on the inbound (eastbound) side of Colonial Drive for morning commuter captureDirection-specific analysis.