The Opportunity
Arbitrage analysis helps you:- Establish realistic offering prices
- Support your valuation in negotiations
- Understand market trends by submarket
- Identify potential arbitrage opportunities—properties that sold below market
Walkthrough: Finding Undervalued Land Sales
Let’s use statistical analysis to find vacant land that sold significantly below the median price per acre for its area. These could represent motivated seller situations, data errors worth investigating, or genuine arbitrage opportunities.Step 1: Select Your Search Area
First, select the boundary you want to analyze.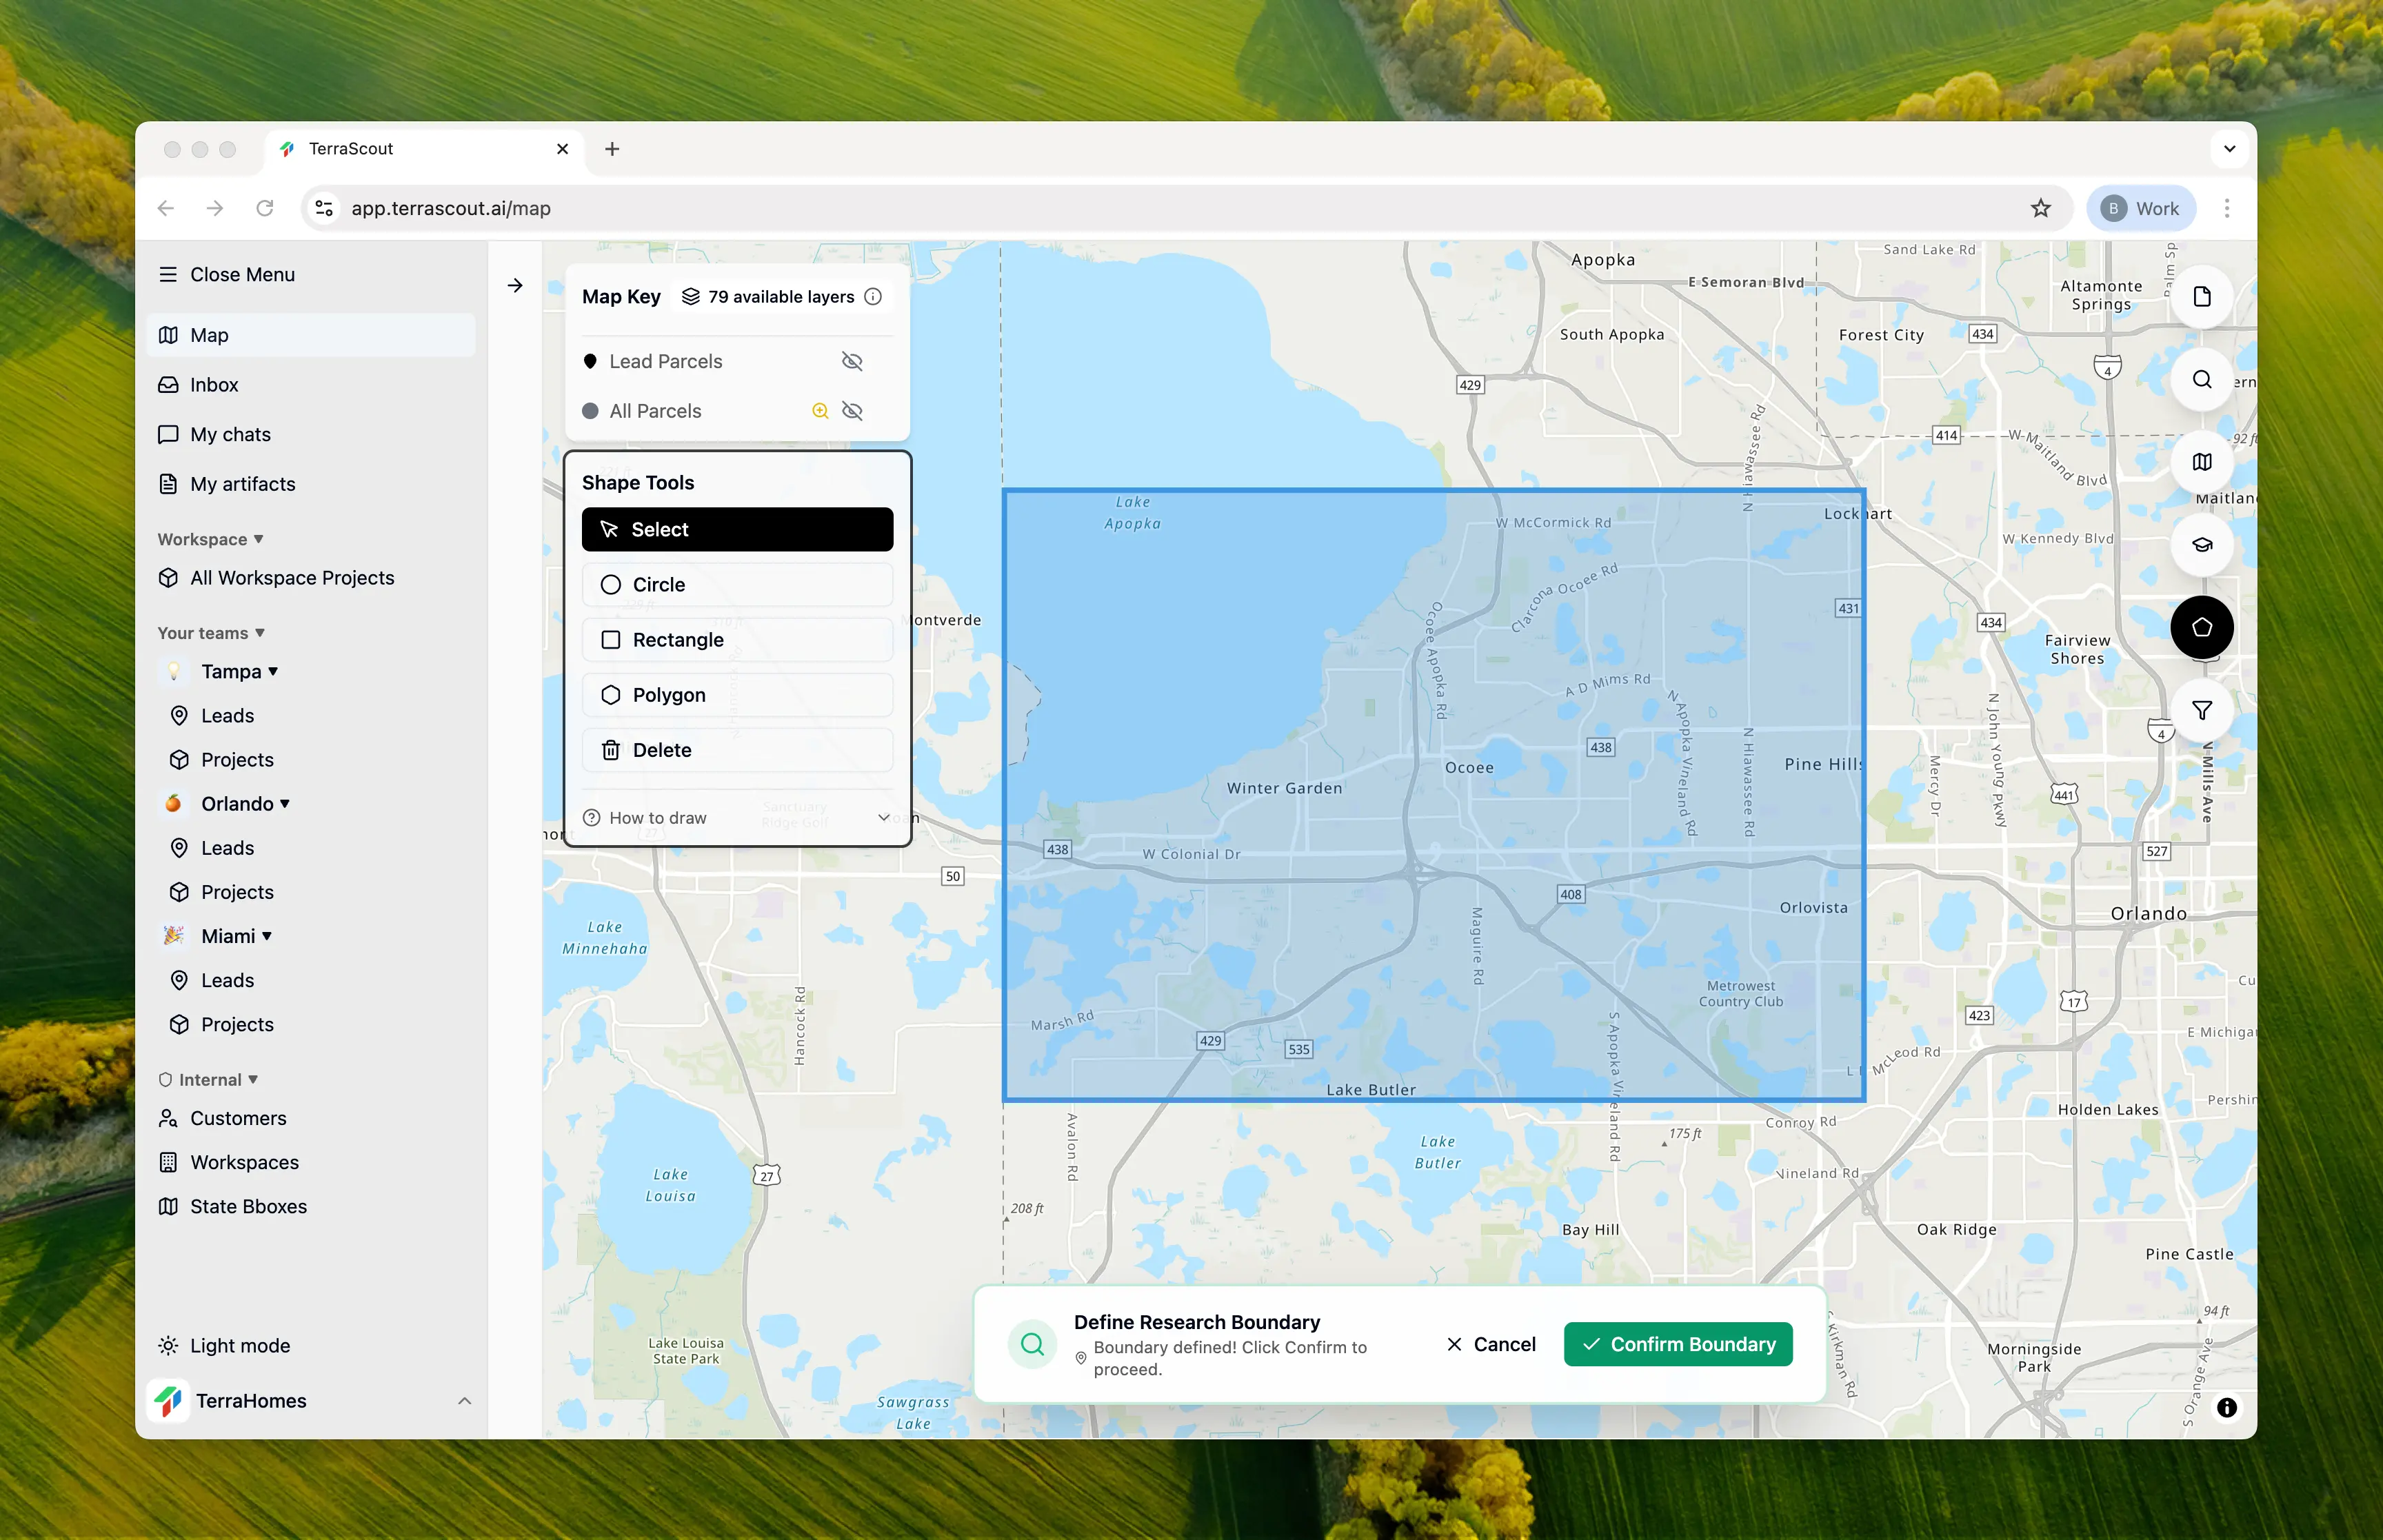
Step 2: Ask for Statistical Analysis
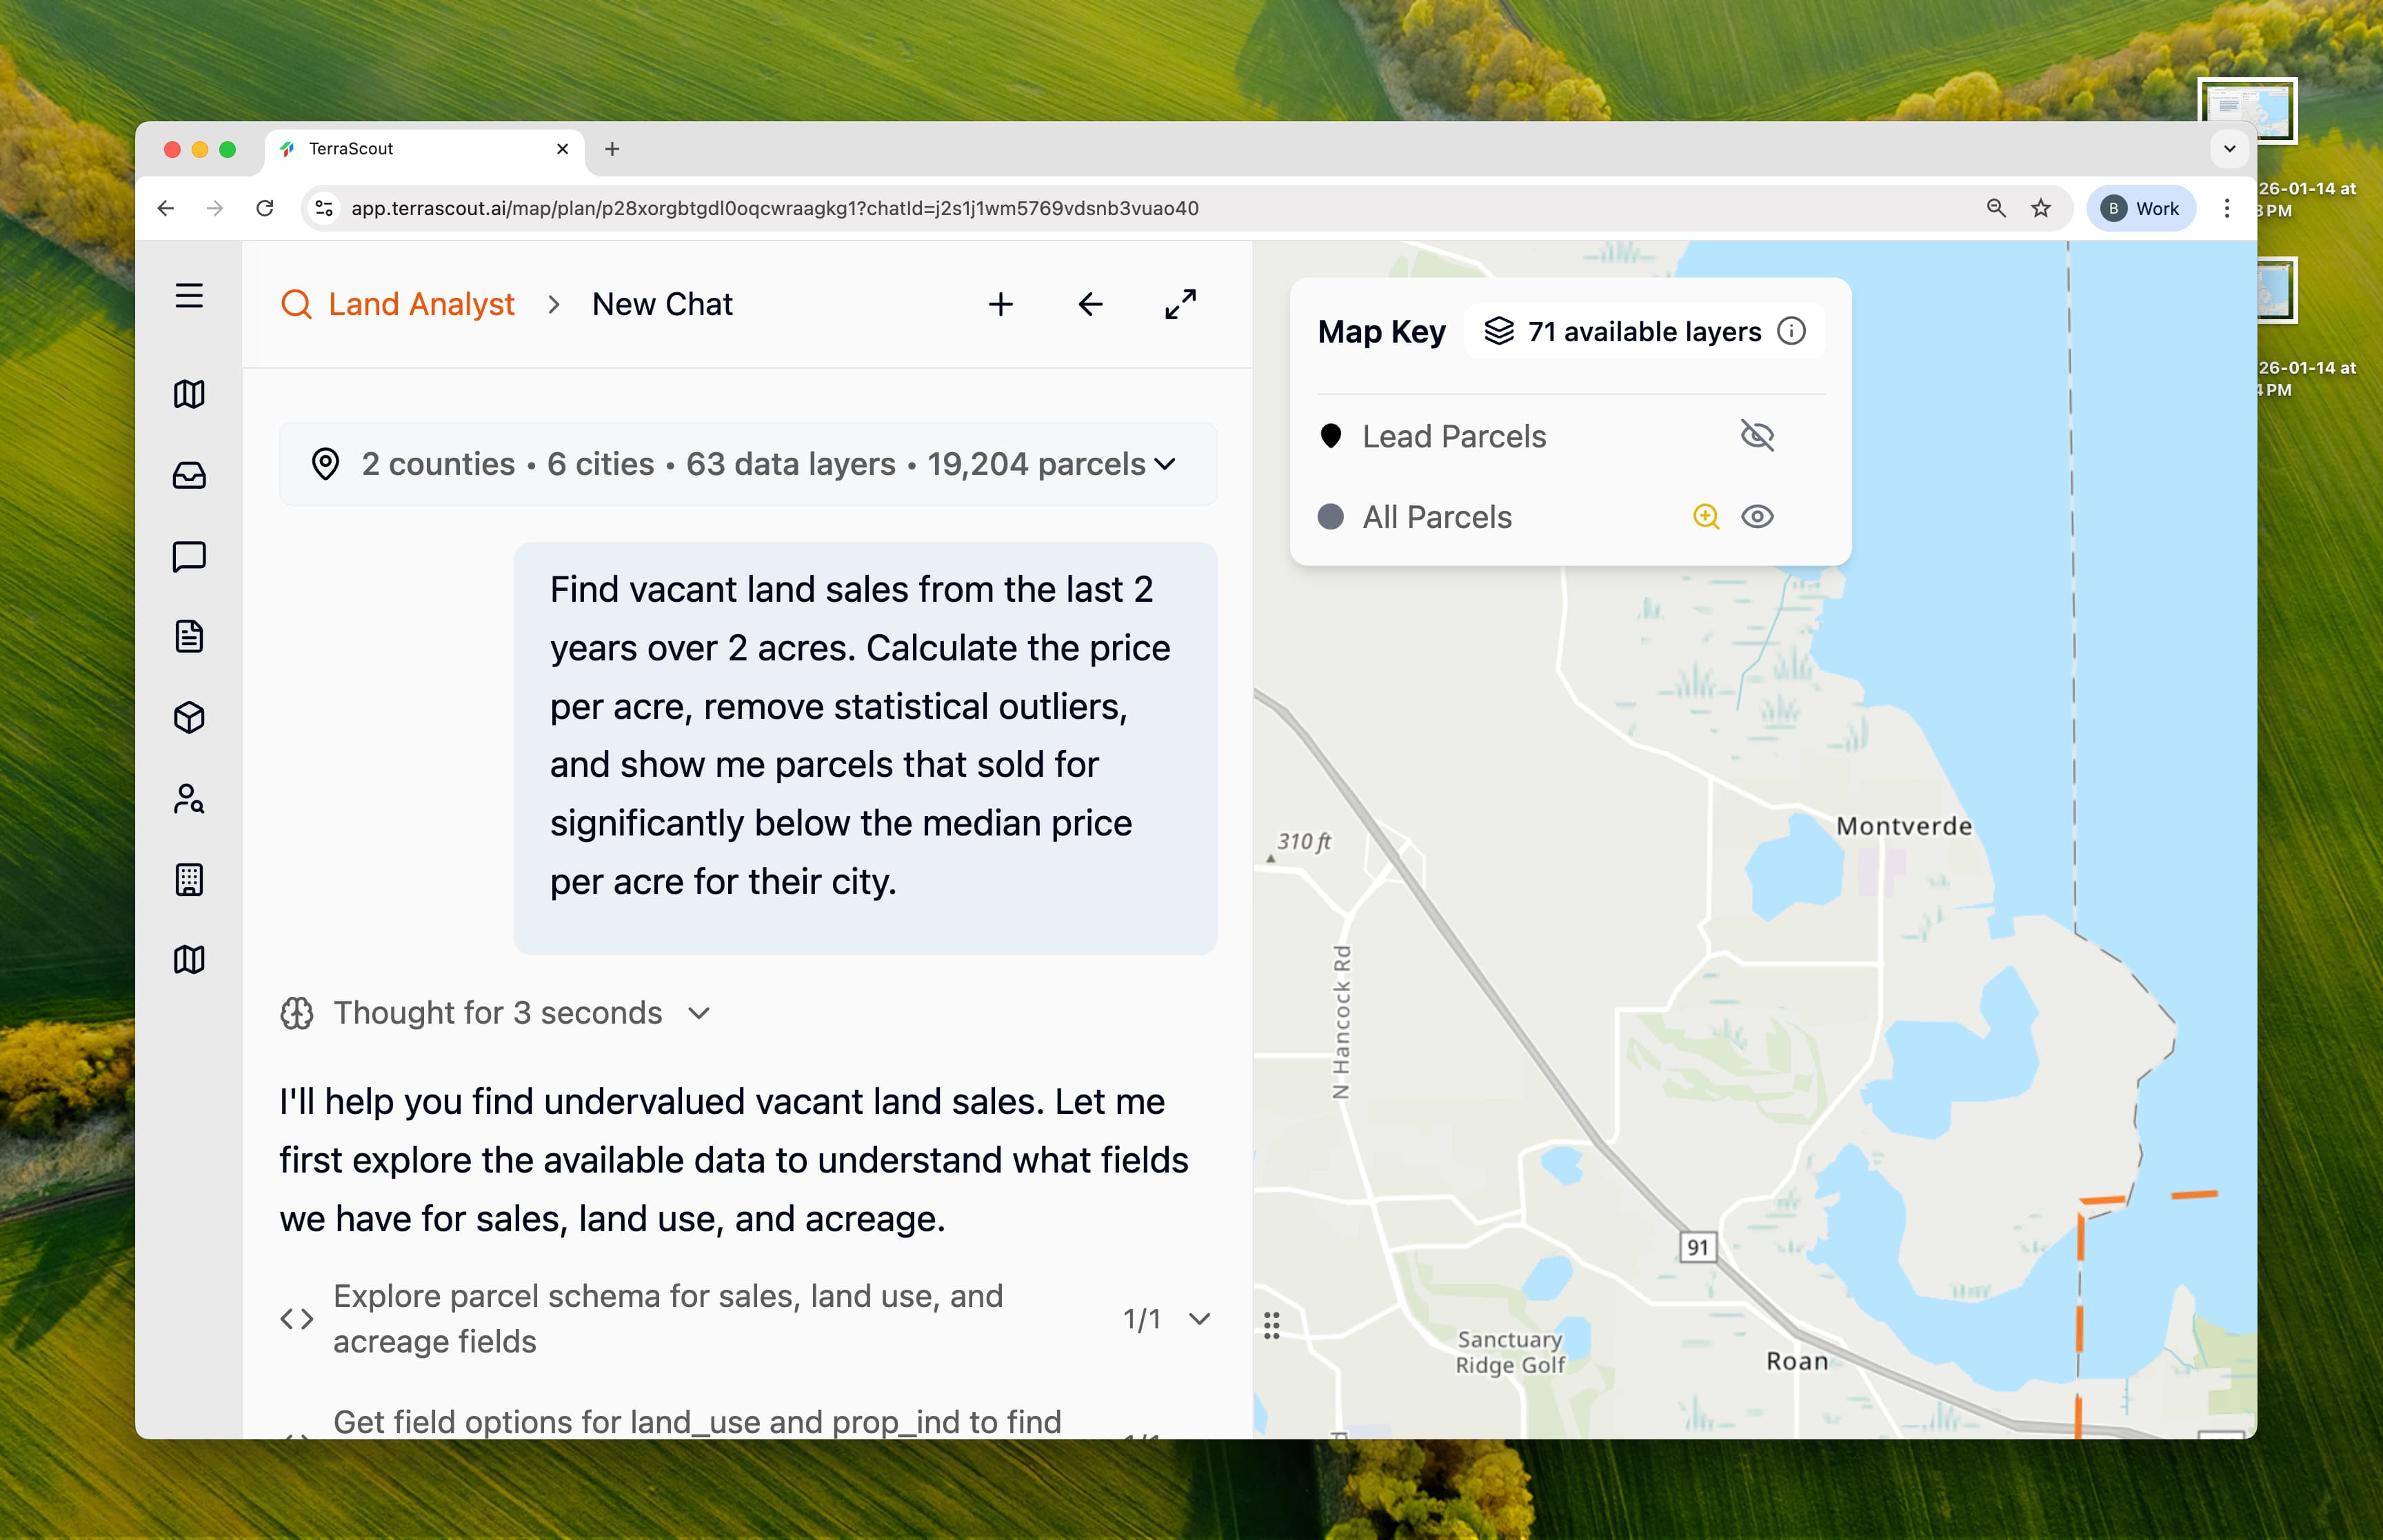
Find vacant land sales from the last 2 years over 2 acres. Calculate the price per acre, remove statistical outliers, and show me parcels that sold for significantly below the median price per acre for their city.This request triggers a multi-step statistical analysis:
- Filter to recent vacant land sales
- Calculate price per acre for each parcel
- Use IQR method to remove outliers
- Compare each sale to its city’s median
- Flag properties 25%+ below median
Step 3: Review the Analysis Plan
Ploti creates a detailed analysis plan showing the methodology: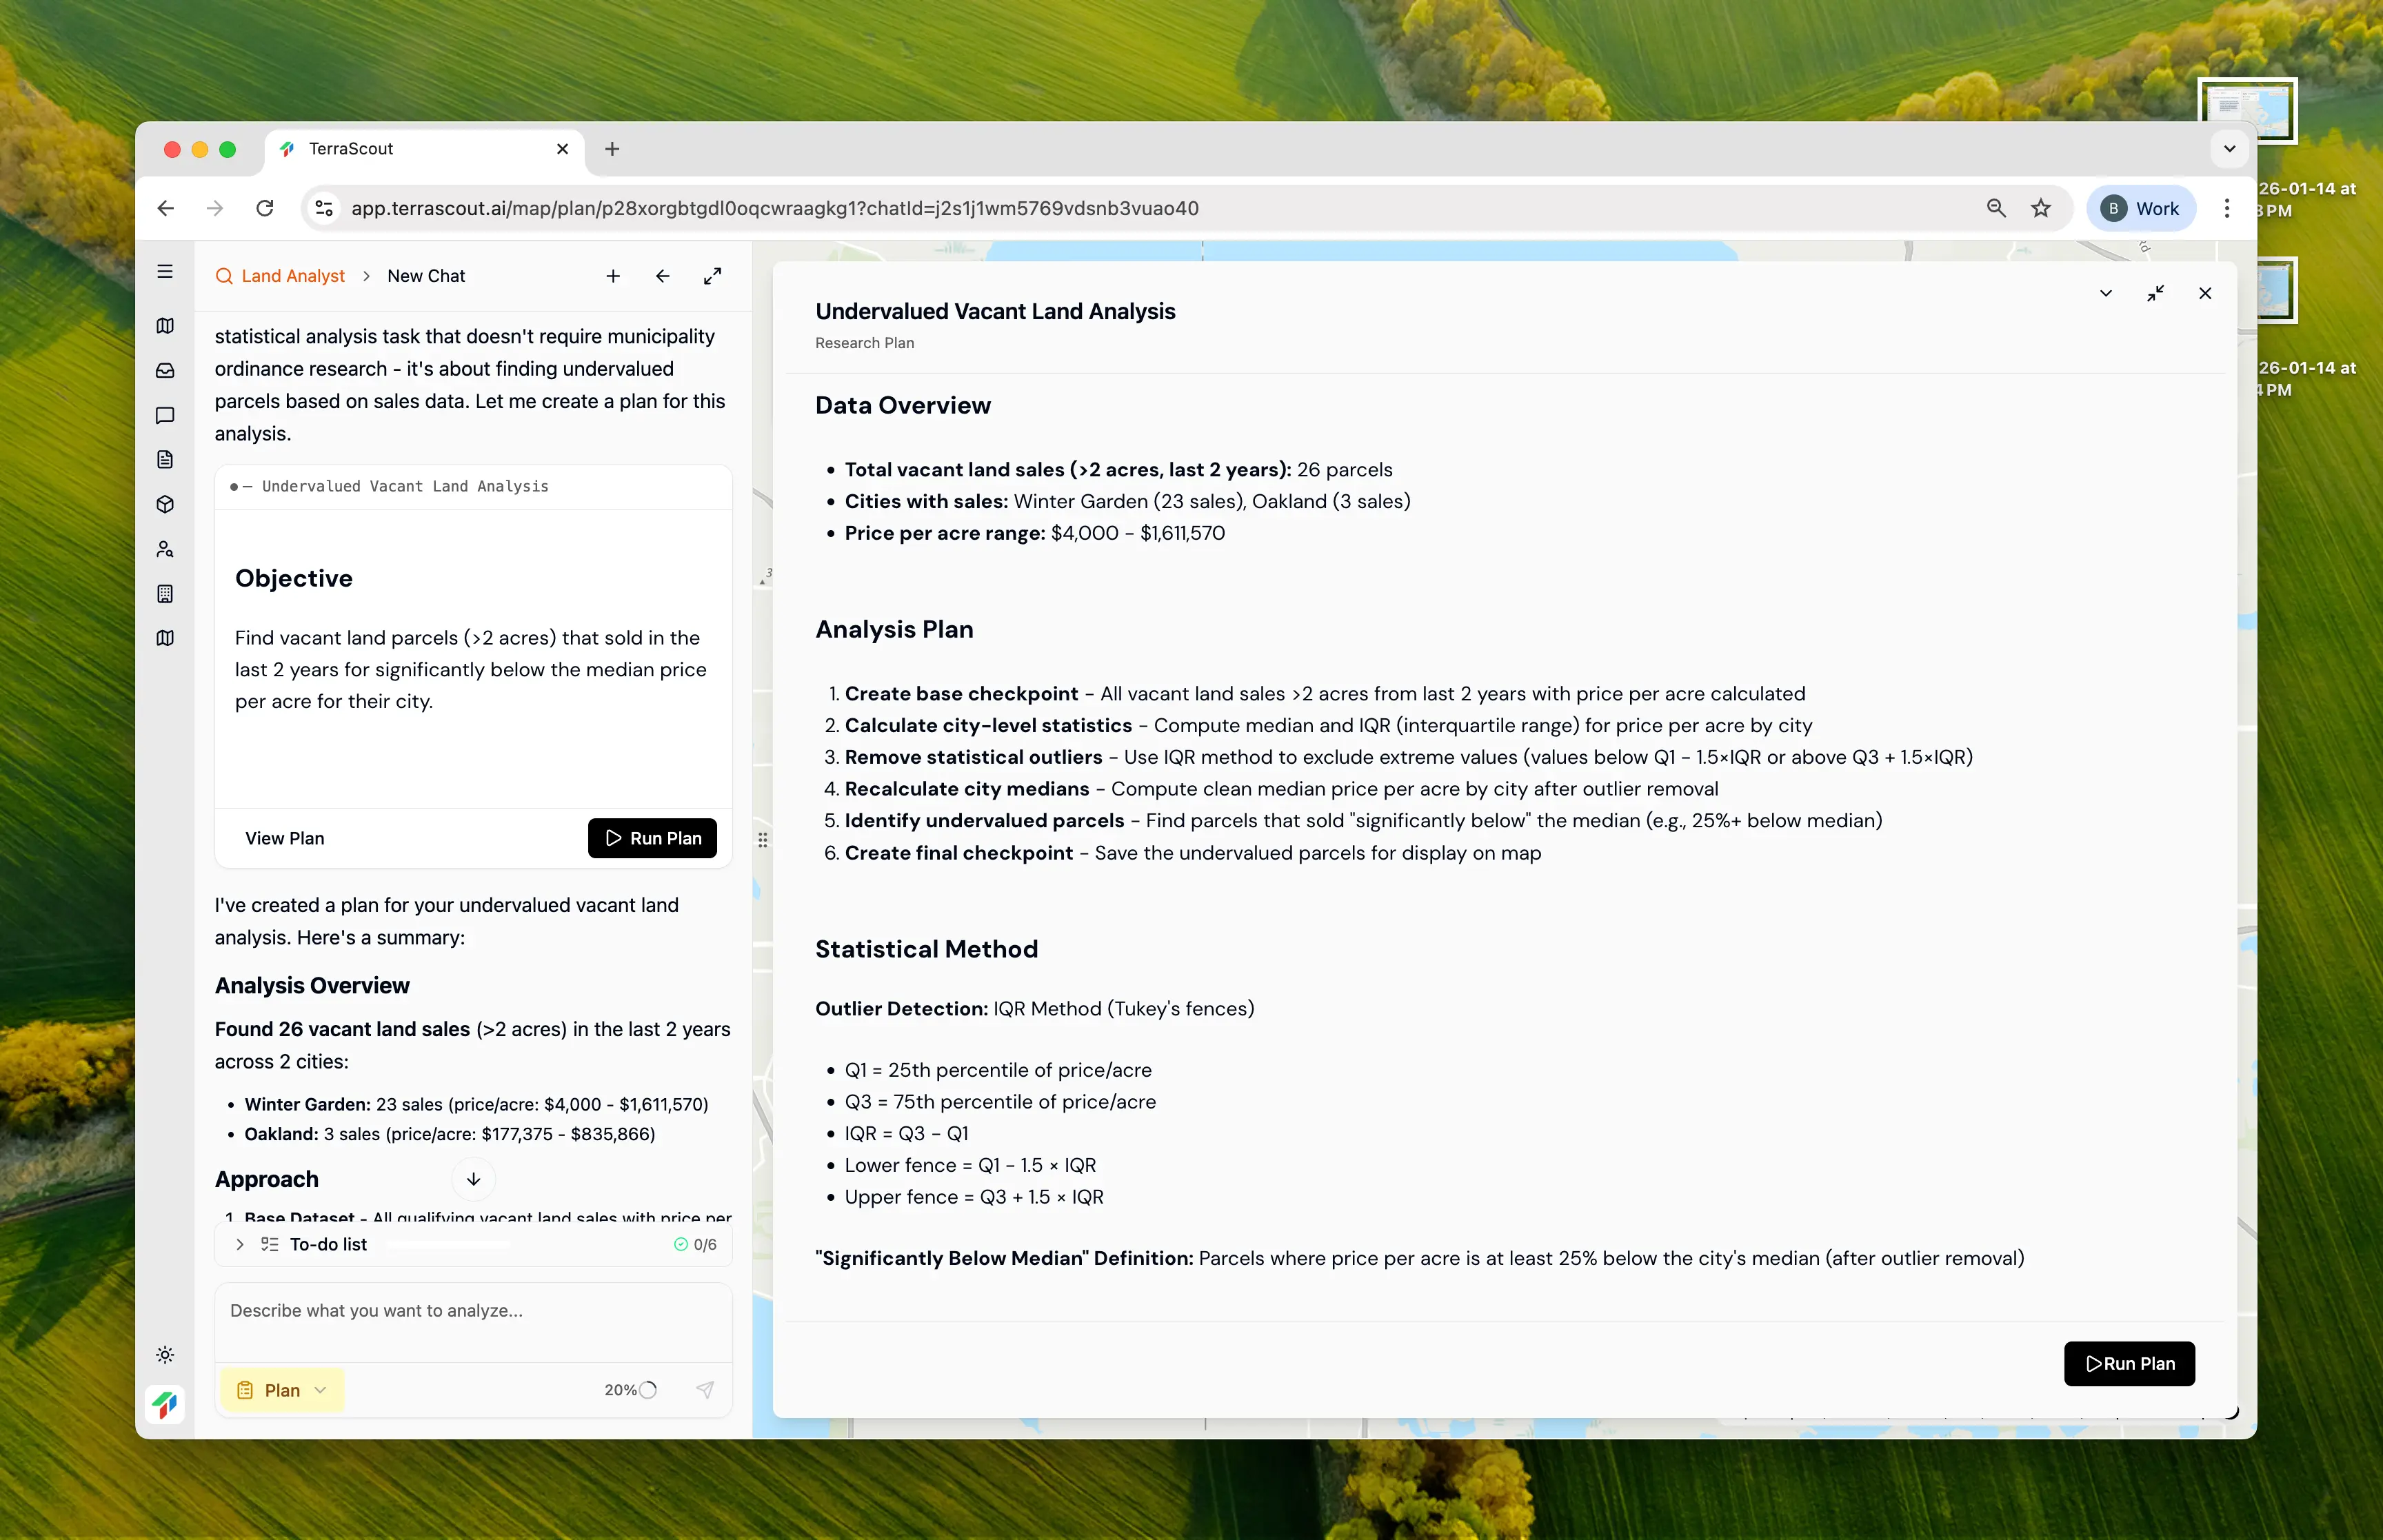
- Base dataset: 26 vacant land sales over 2 acres from the last 2 years
- Outlier detection: IQR method (Tukey’s fences) to remove extreme values
- City medians: Oakland at 520,532/acre
- Threshold: Parcels 25%+ below their city’s median
Step 4: Review Base Dataset
First, Ploti creates a checkpoint with all qualifying sales: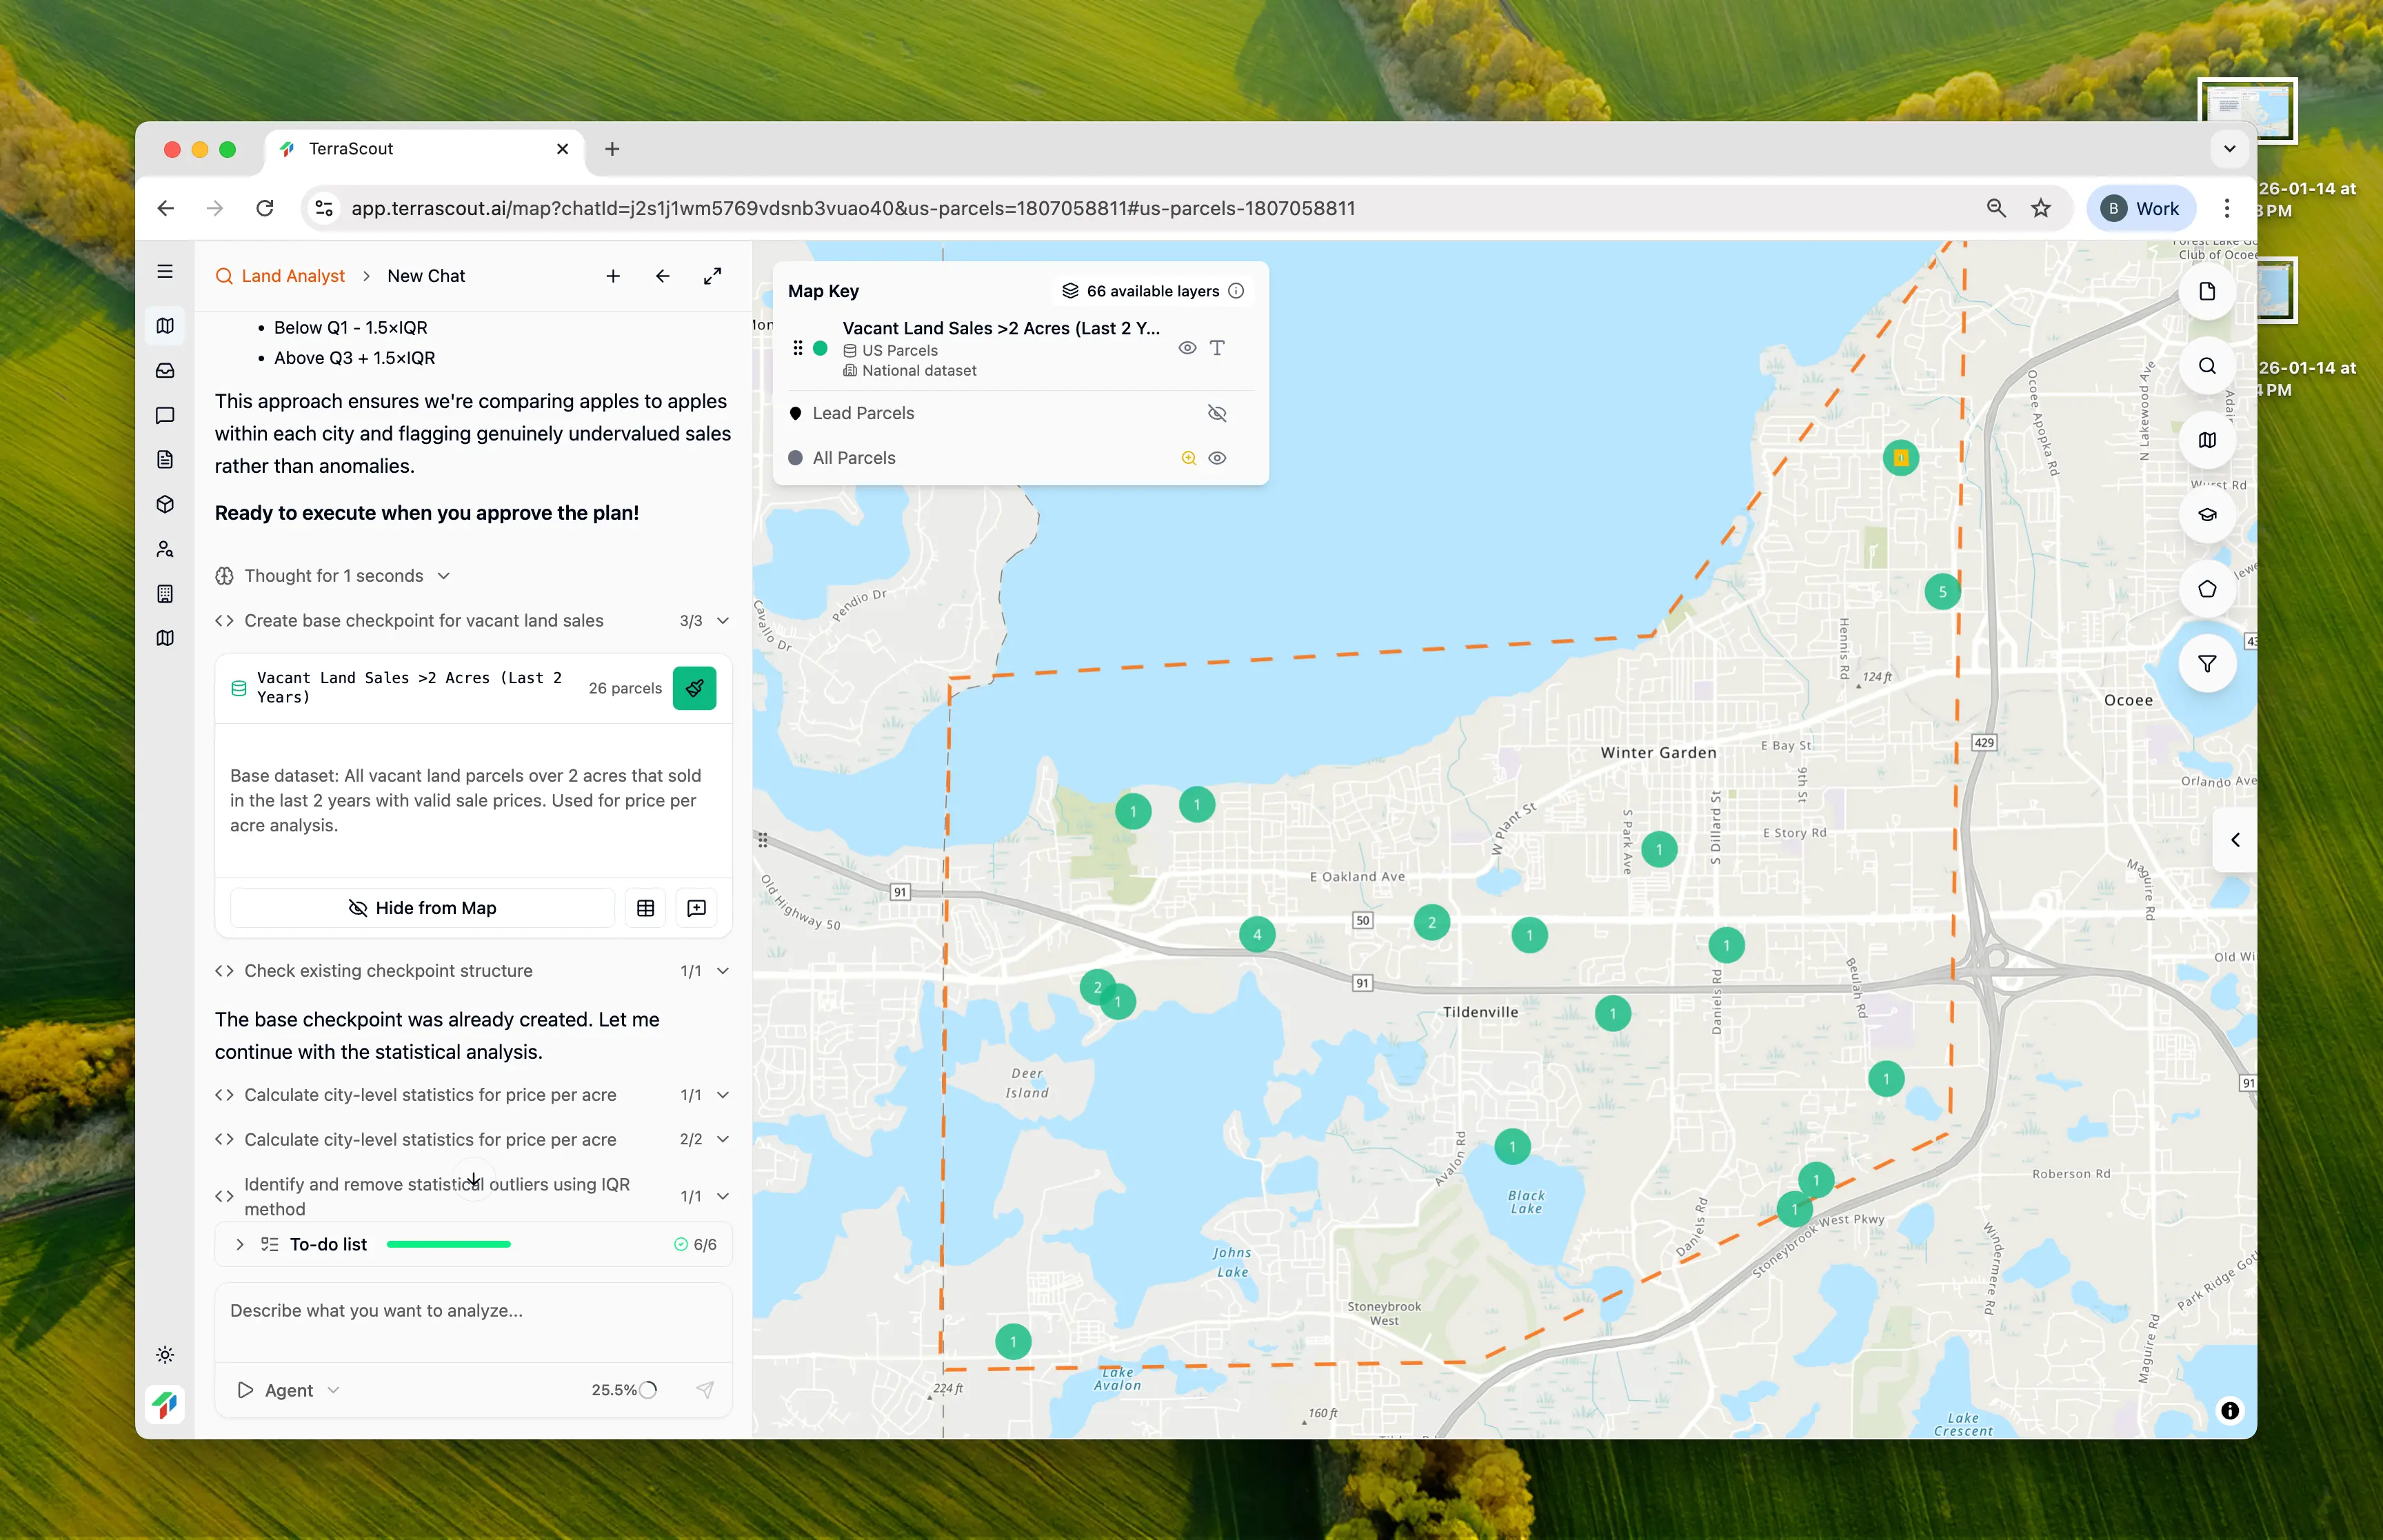
Step 5: Review Undervalued Results
After applying the statistical filters, Ploti identifies 10 undervalued parcels: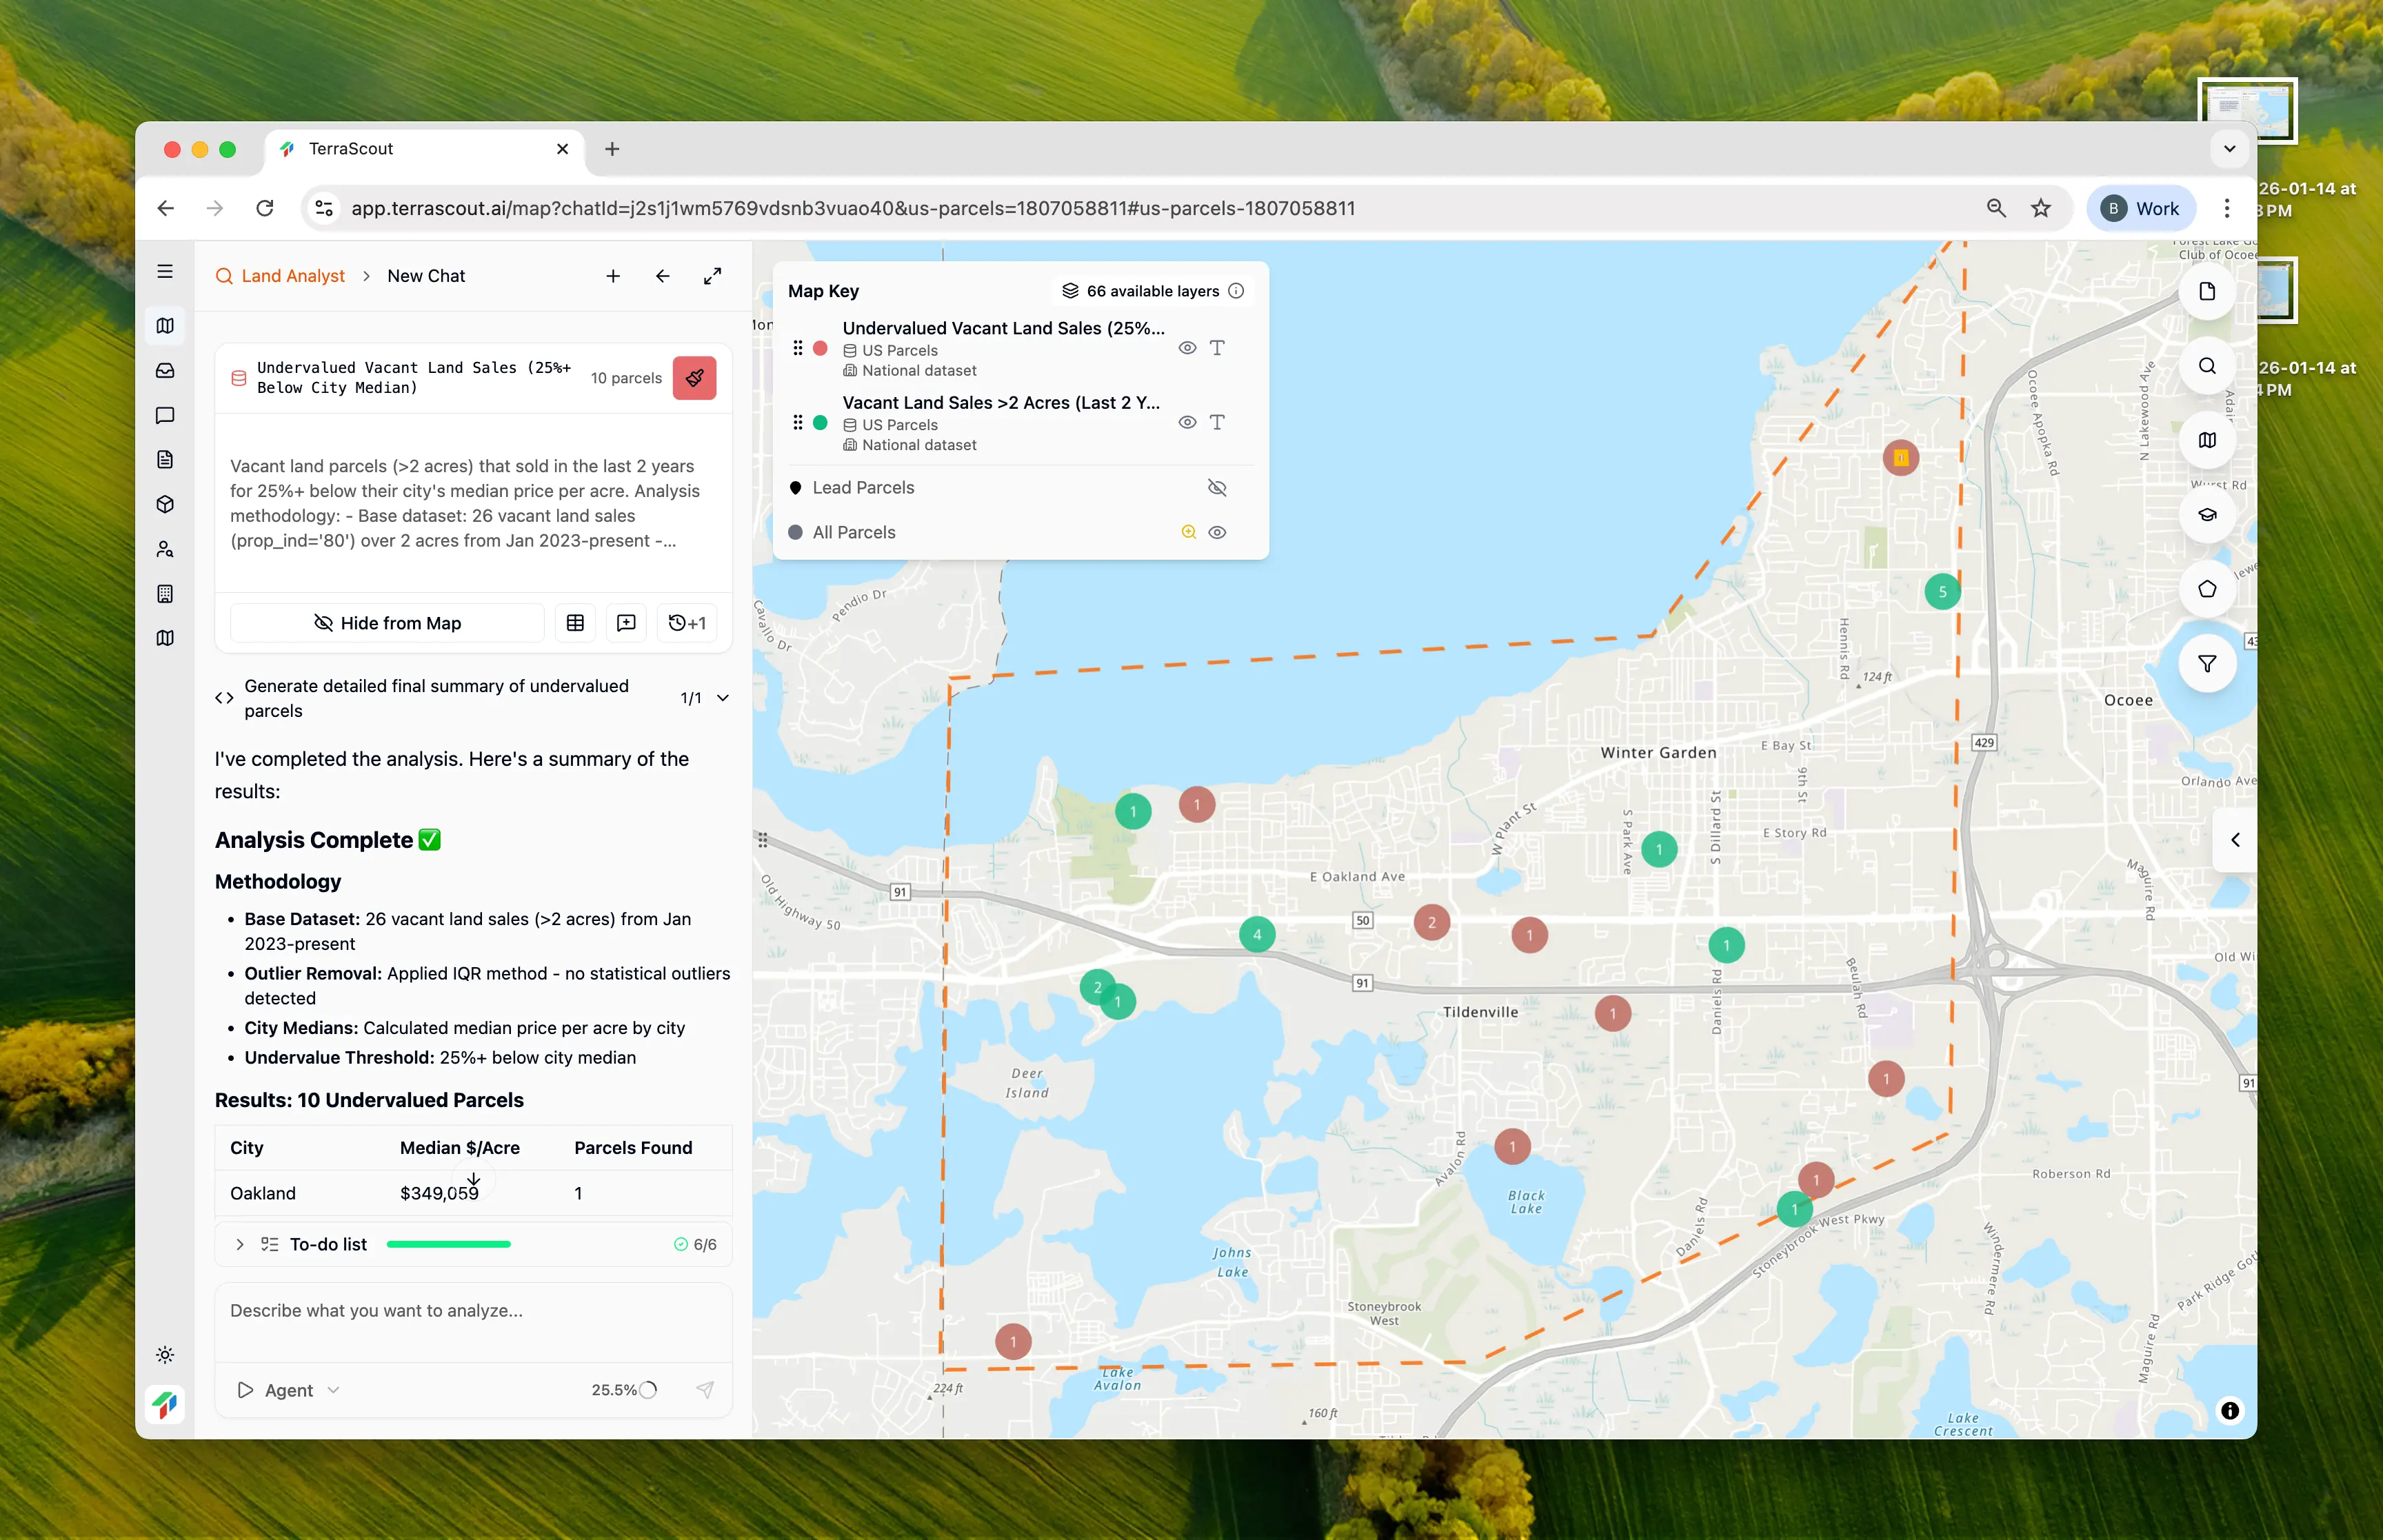
Step 6: Analyze the Findings
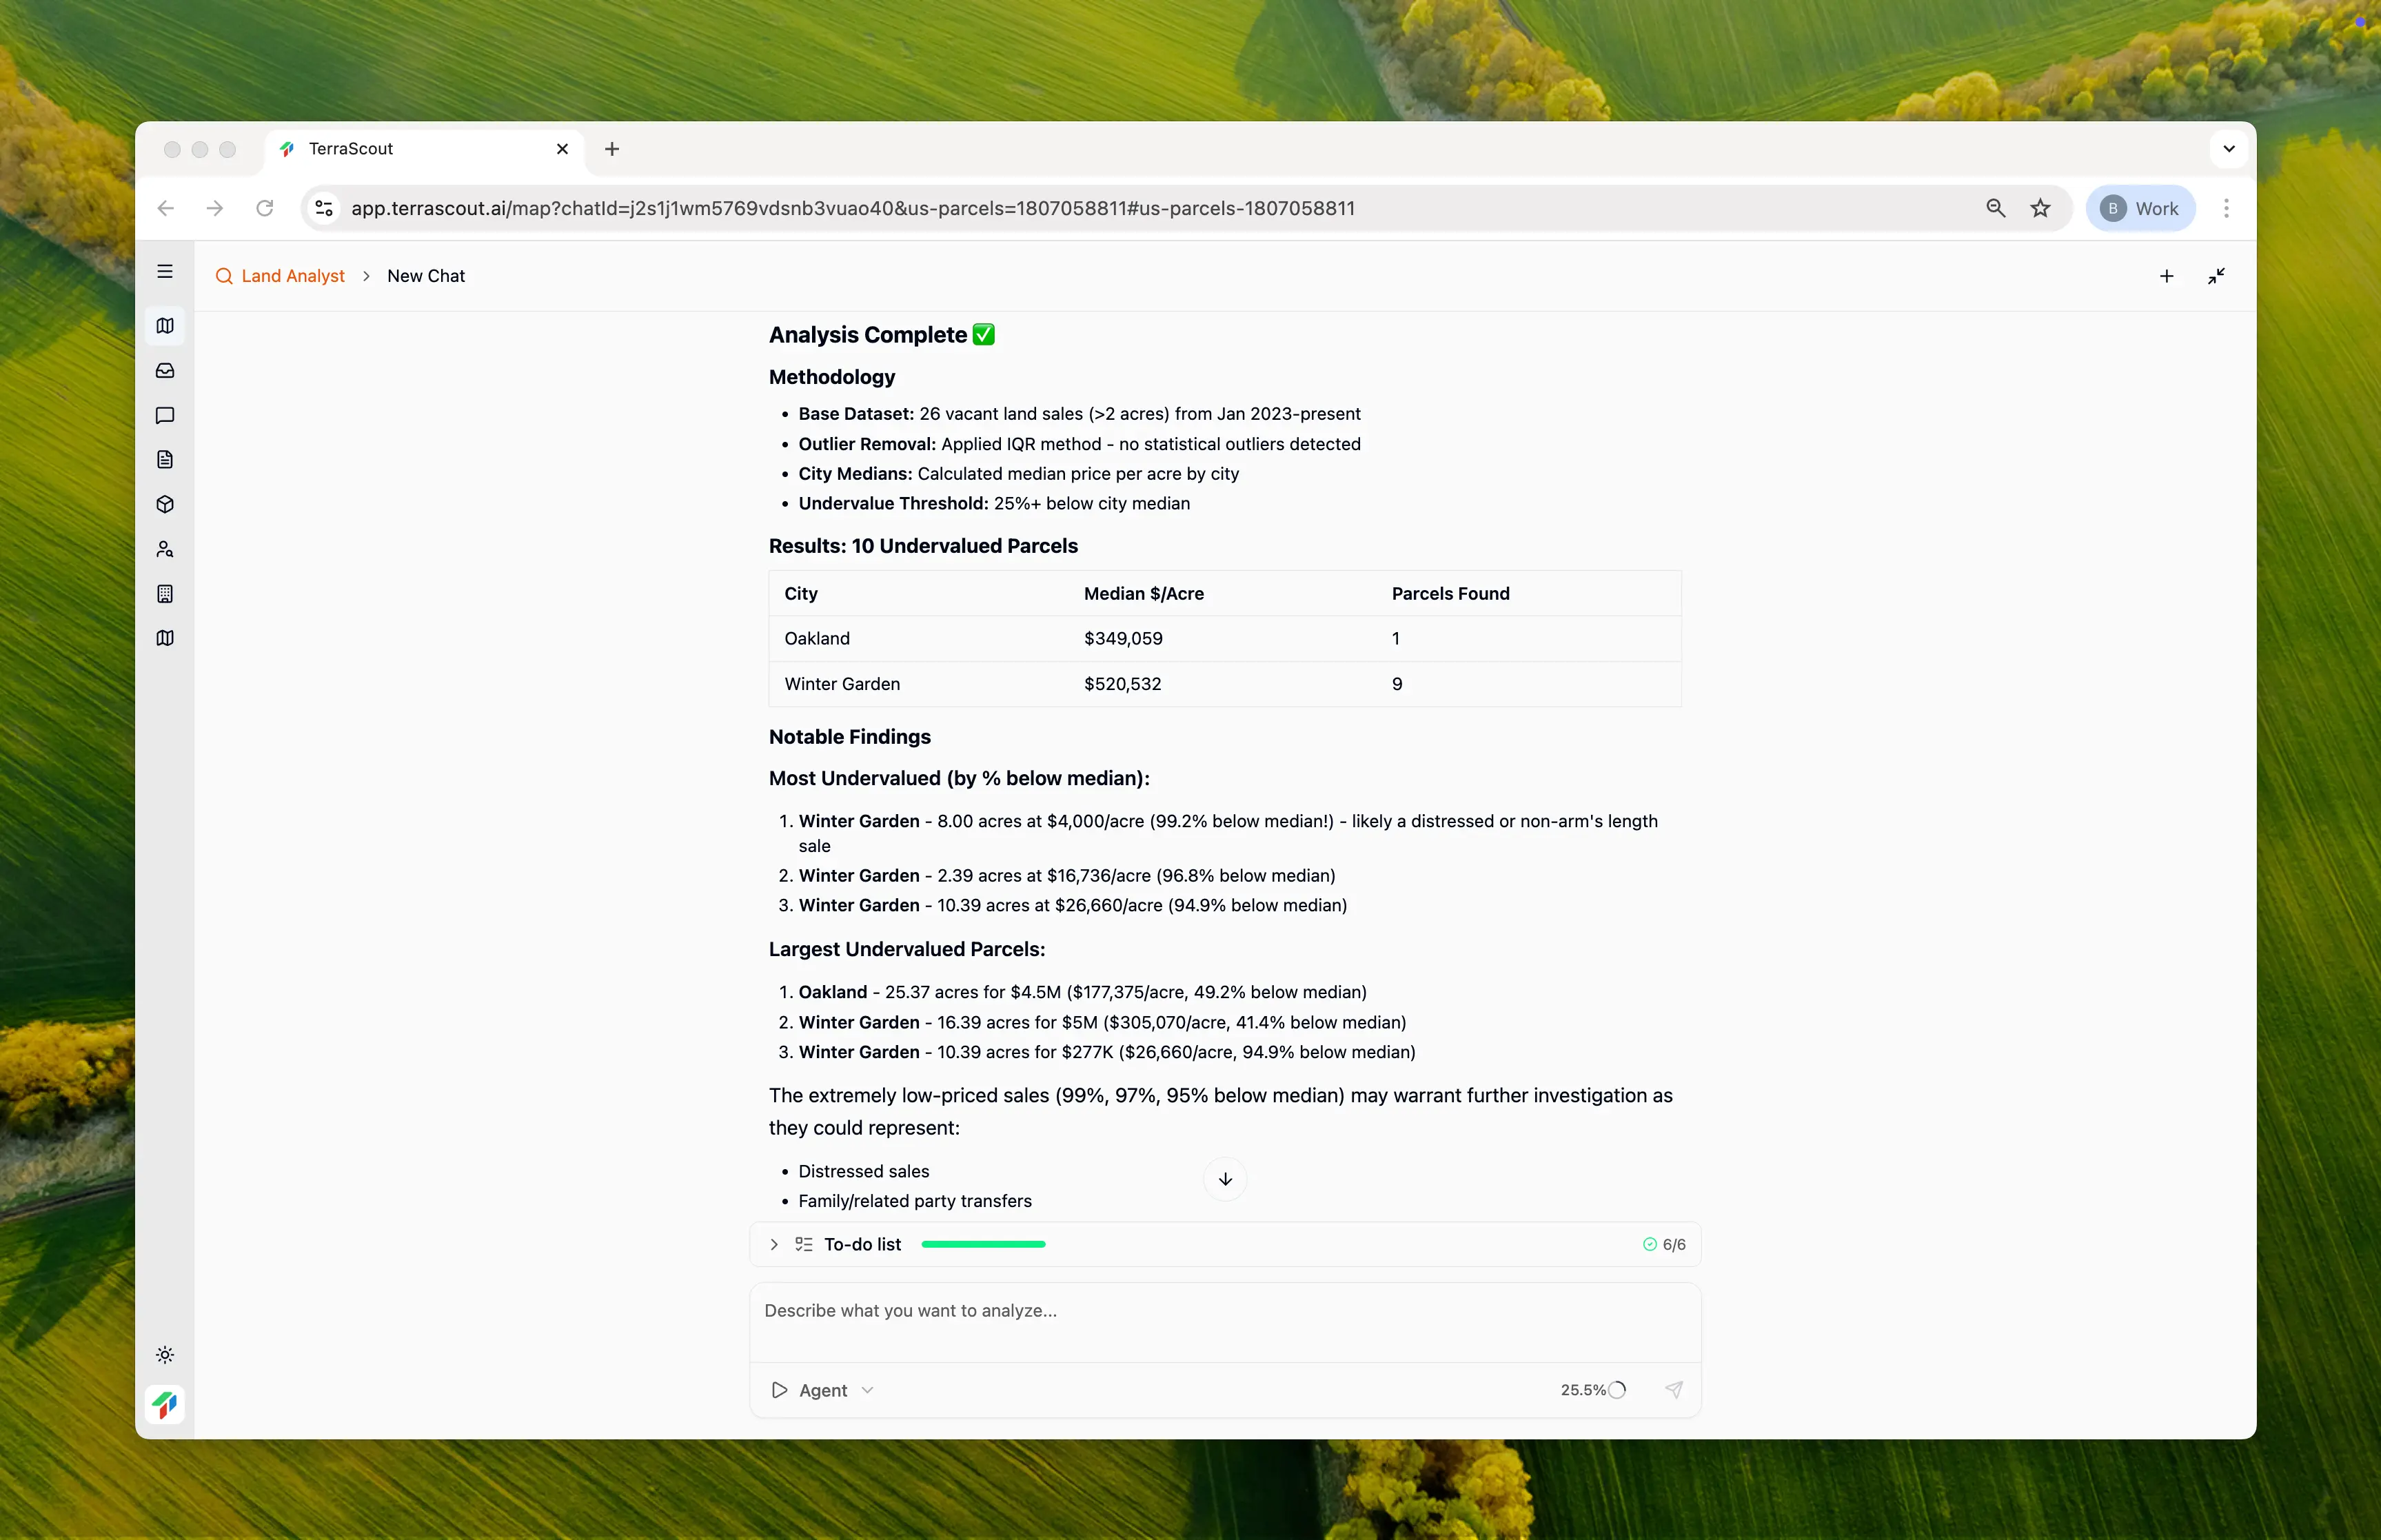
| City | Median $/Acre | Parcels Found |
|---|---|---|
| Oakland | $349,059 | 1 |
| Winter Garden | $520,532 | 9 |
- Winter Garden — 8.00 acres at $4,000/acre (99.2% below median)
- Winter Garden — 2.39 acres at $16,736/acre (96.8% below median)
- Oakland — 25.37 acres at $177,375/acre (49.2% below median)
- Distressed or motivated seller situations
- Family/related party transfers
- Sales with deed restrictions
- Data entry errors worth verifying
Why This Matters
This isn’t just filtering—it’s real statistical analysis:- IQR outlier removal prevents skewed medians from data anomalies
- City-level grouping compares apples to apples within submarkets
- Percentage thresholds identify genuinely significant deviations
- Actionable output gives you specific parcels to investigate
The Time Savings
Without Ploti, this analysis would require:- Exporting sales data from multiple county sources
- Cleaning and normalizing the data in Excel or pandas
- Calculating price per acre for each parcel
- Writing Python code to compute IQR bounds
- Implementing outlier removal logic
- Grouping by submarket and calculating medians
- Comparing each sale to its submarket median
- Flagging properties below threshold
Tips
- The best comps are recent, nearby, and similar in size and zoning
- Extremely low sales (90%+ below median) often indicate non-arm’s-length transactions
- Verify outliers before acting—some are data errors, others are real opportunities
- Consider why a property sold cheap before assuming it’s undervalued
Other Example Prompts
Simple Comp Search
Show me vacant land sales between 5-20 acres from the last 18 monthsFind recent transactions without statistical analysis.
Price Per Acre by Submarket
What’s the average price per acre for vacant land sales by city in the last 2 years?Understand pricing differences across submarkets.
High-Value Transactions
Find all land sales over $1 million in the last year and show the price per acreFocus on institutional-scale transactions.
Zoned Land Pricing
Compare the median sale price per acre for commercially-zoned vs residentially-zoned vacant landUnderstand the zoning premium in your market.