The Opportunity
Distribution facilities need sites on roads that can handle truck traffic:- Heavy vehicle load capacity
- Adequate turn radii and lane widths
- Minimal residential conflicts
- Connection to regional freight networks
Walkthrough: Finding Sites on Real Trucking Routes
Let’s find industrial sites with good truck access for a distribution facility. We want to understand which sites are on established freight corridors versus regular roads.Step 1: Select Your Search Area
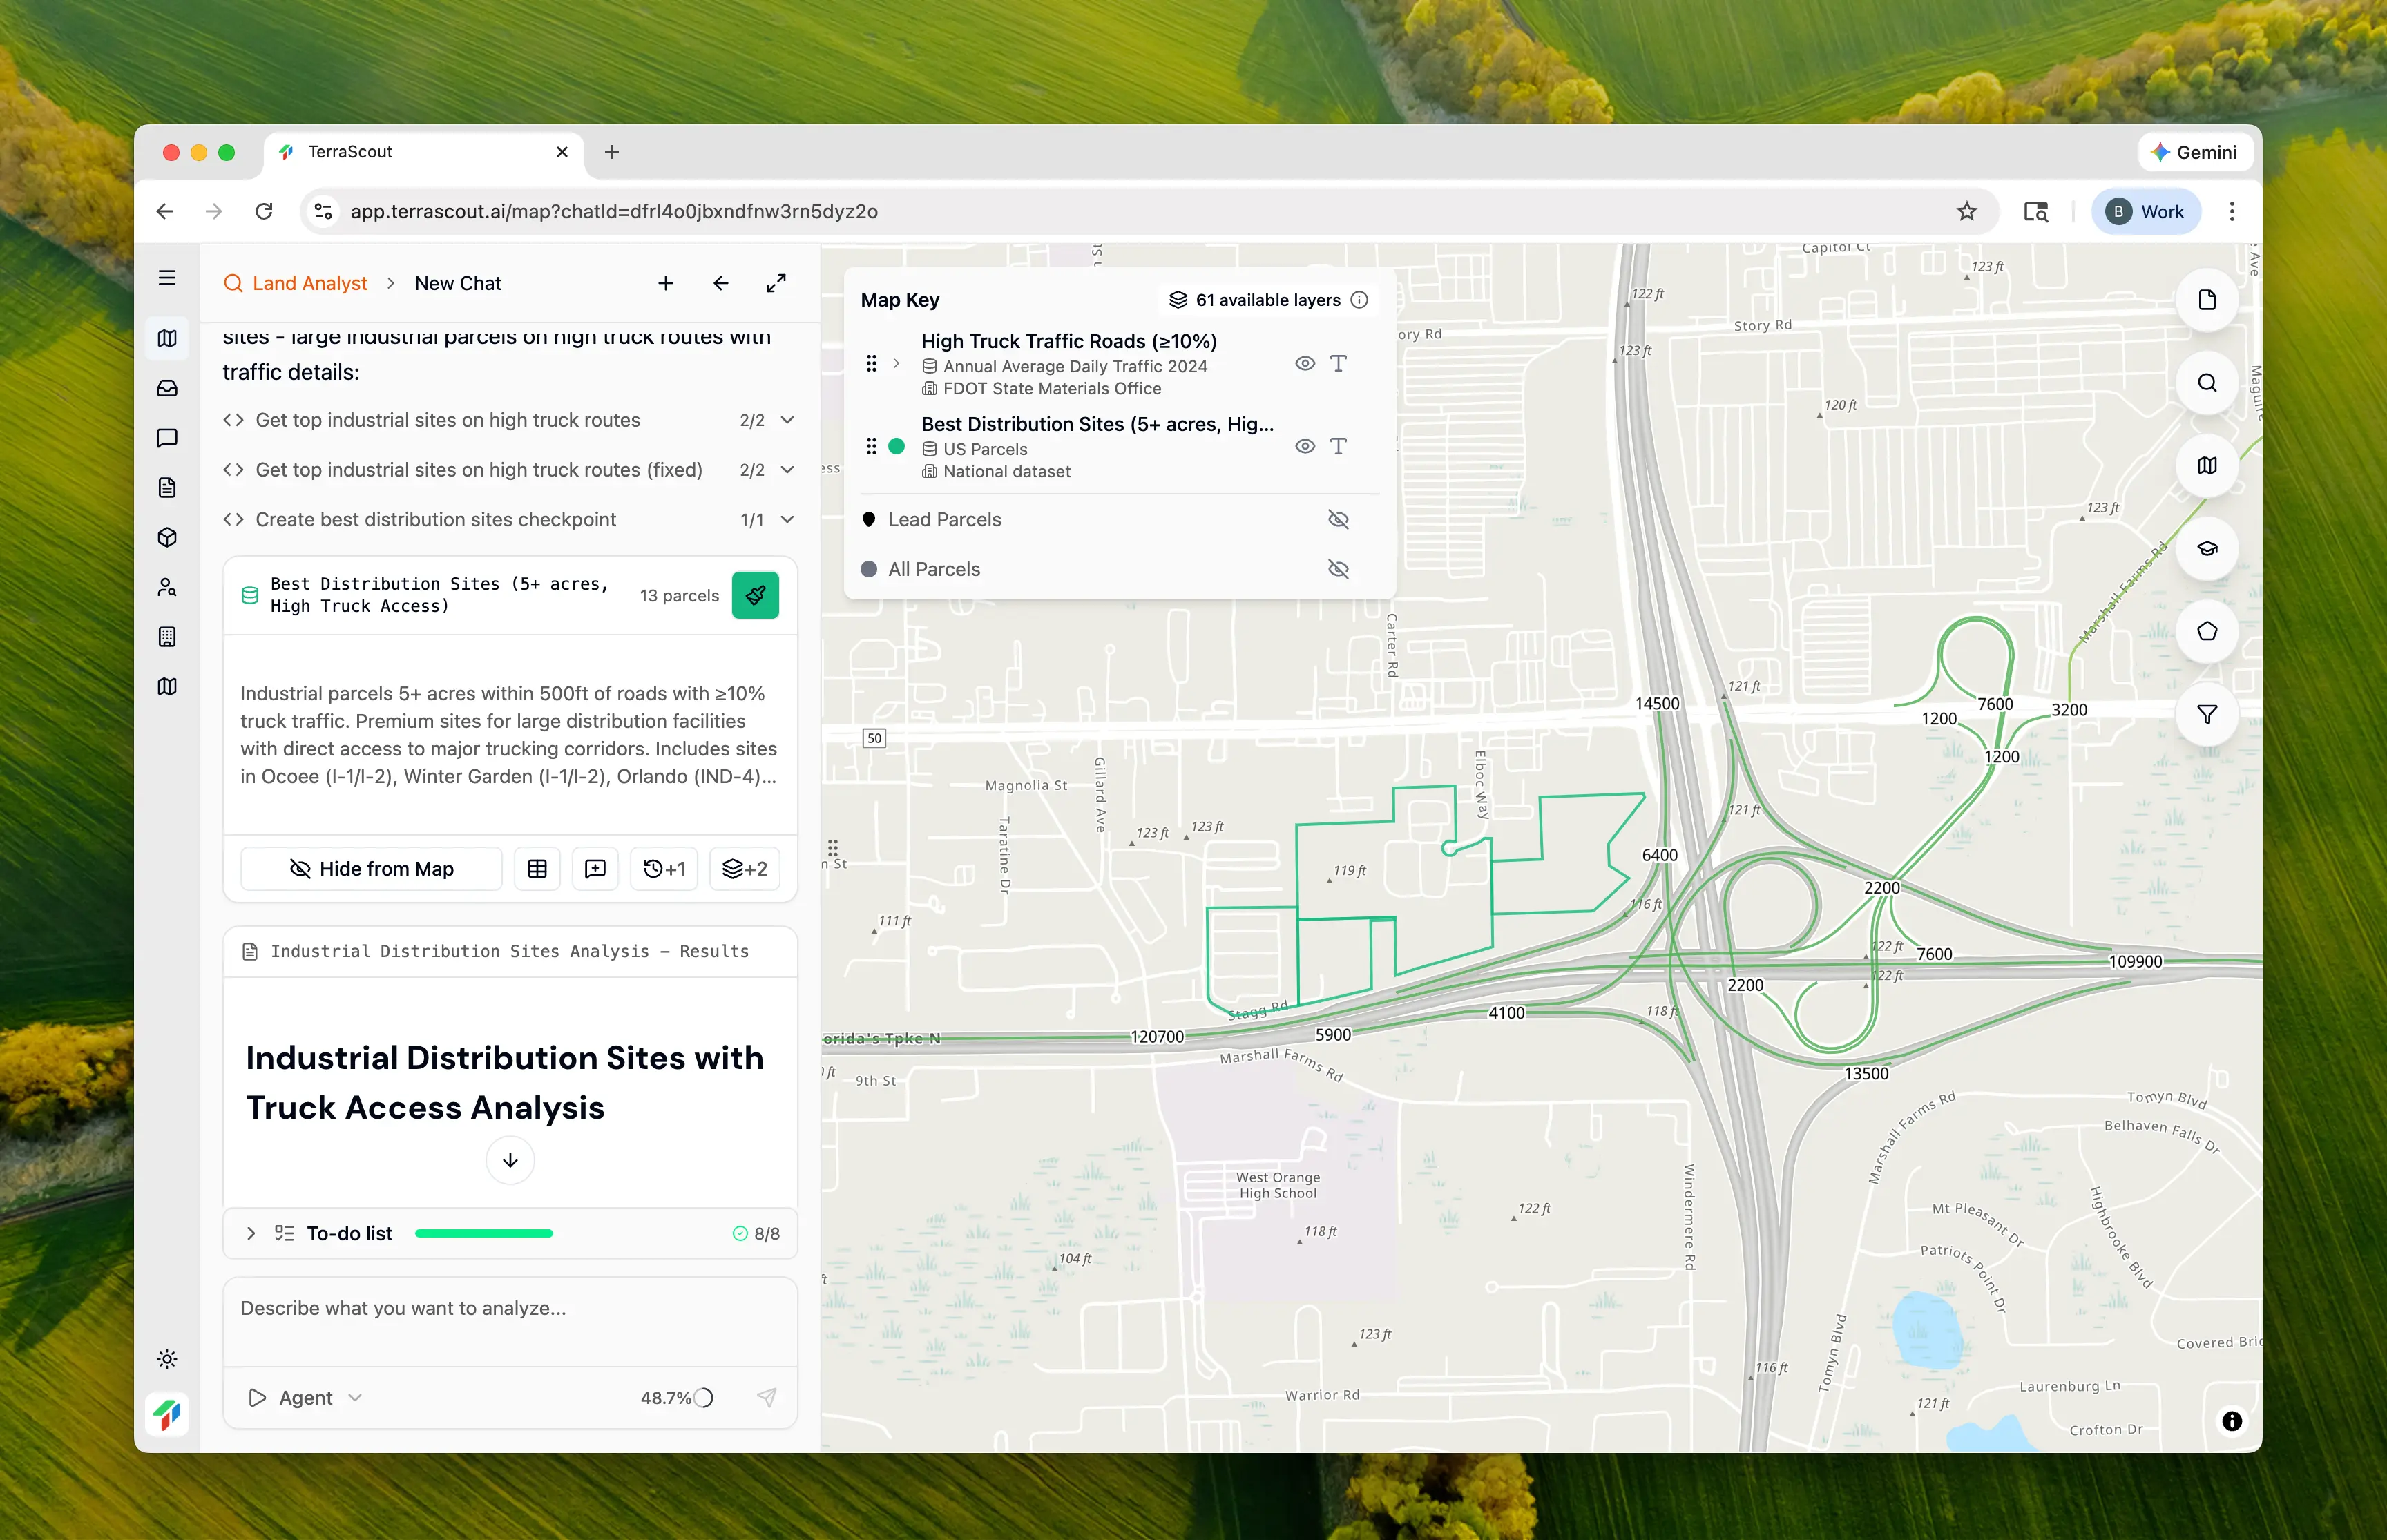
Draw a boundary around your target market. In this example, we drew an area spanning Orlando, Winter Garden, Ocoee, and Apopka—the main industrial corridors in west Orange County.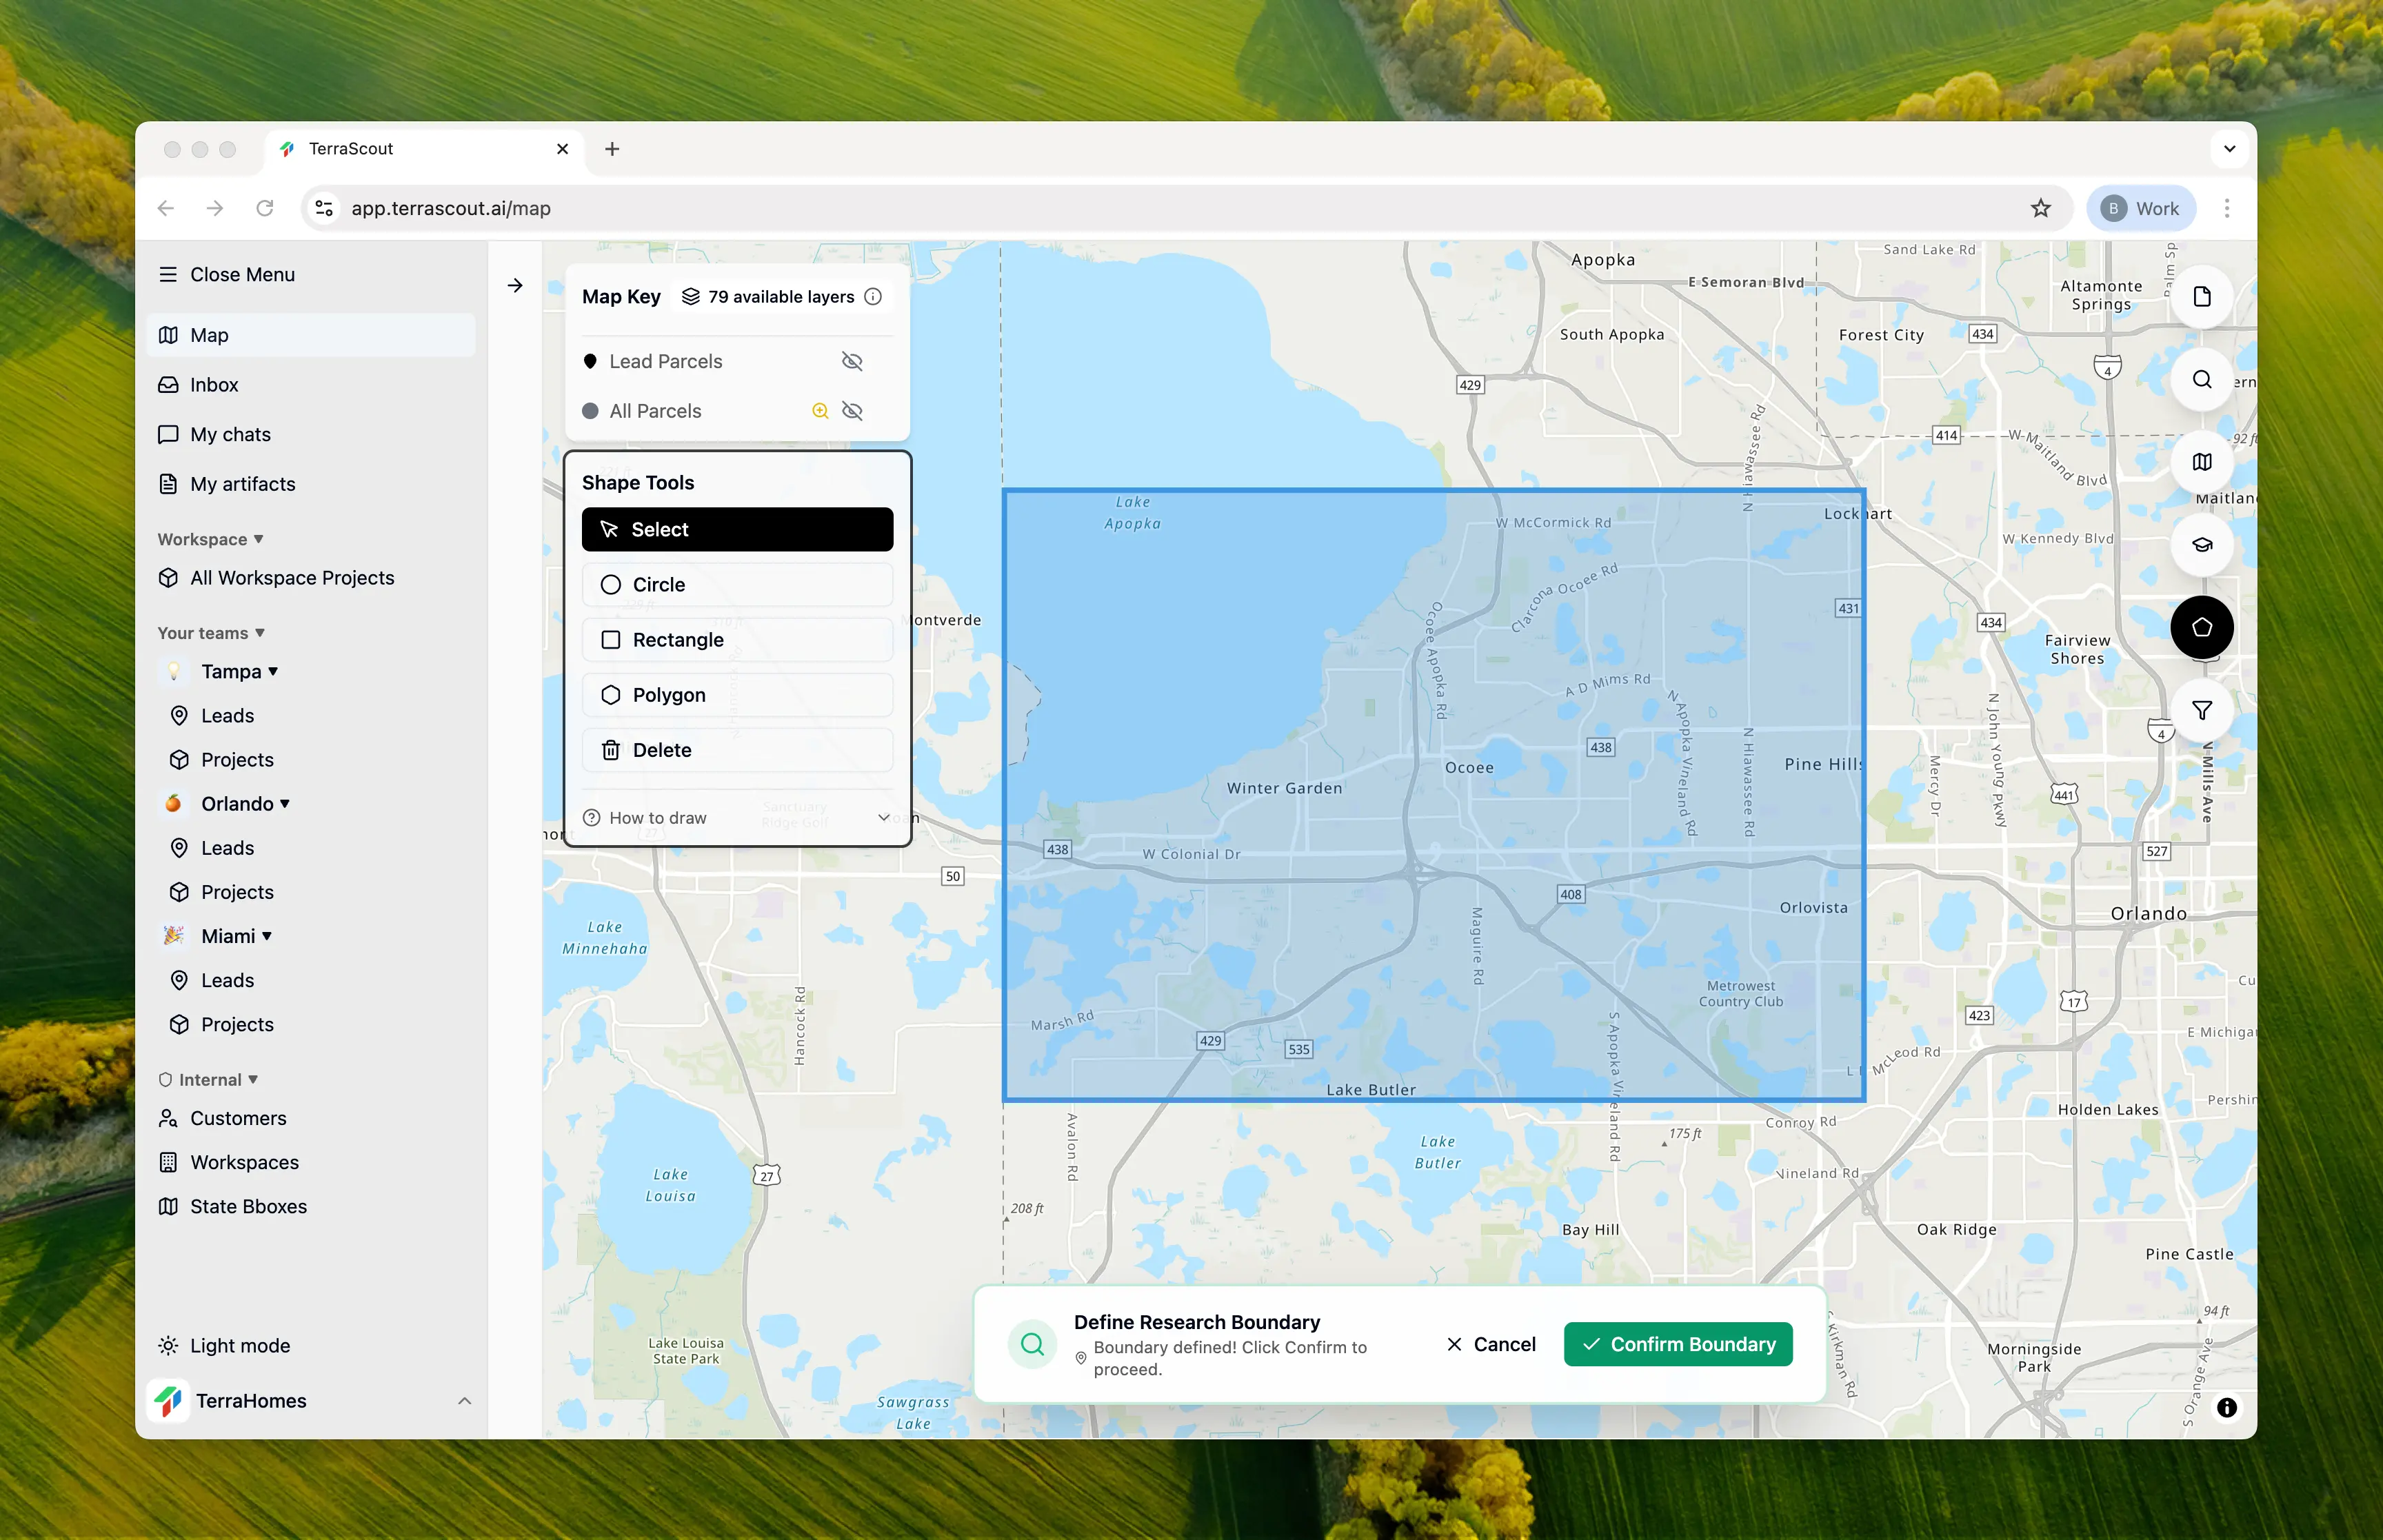
Step 2: Ask the Question
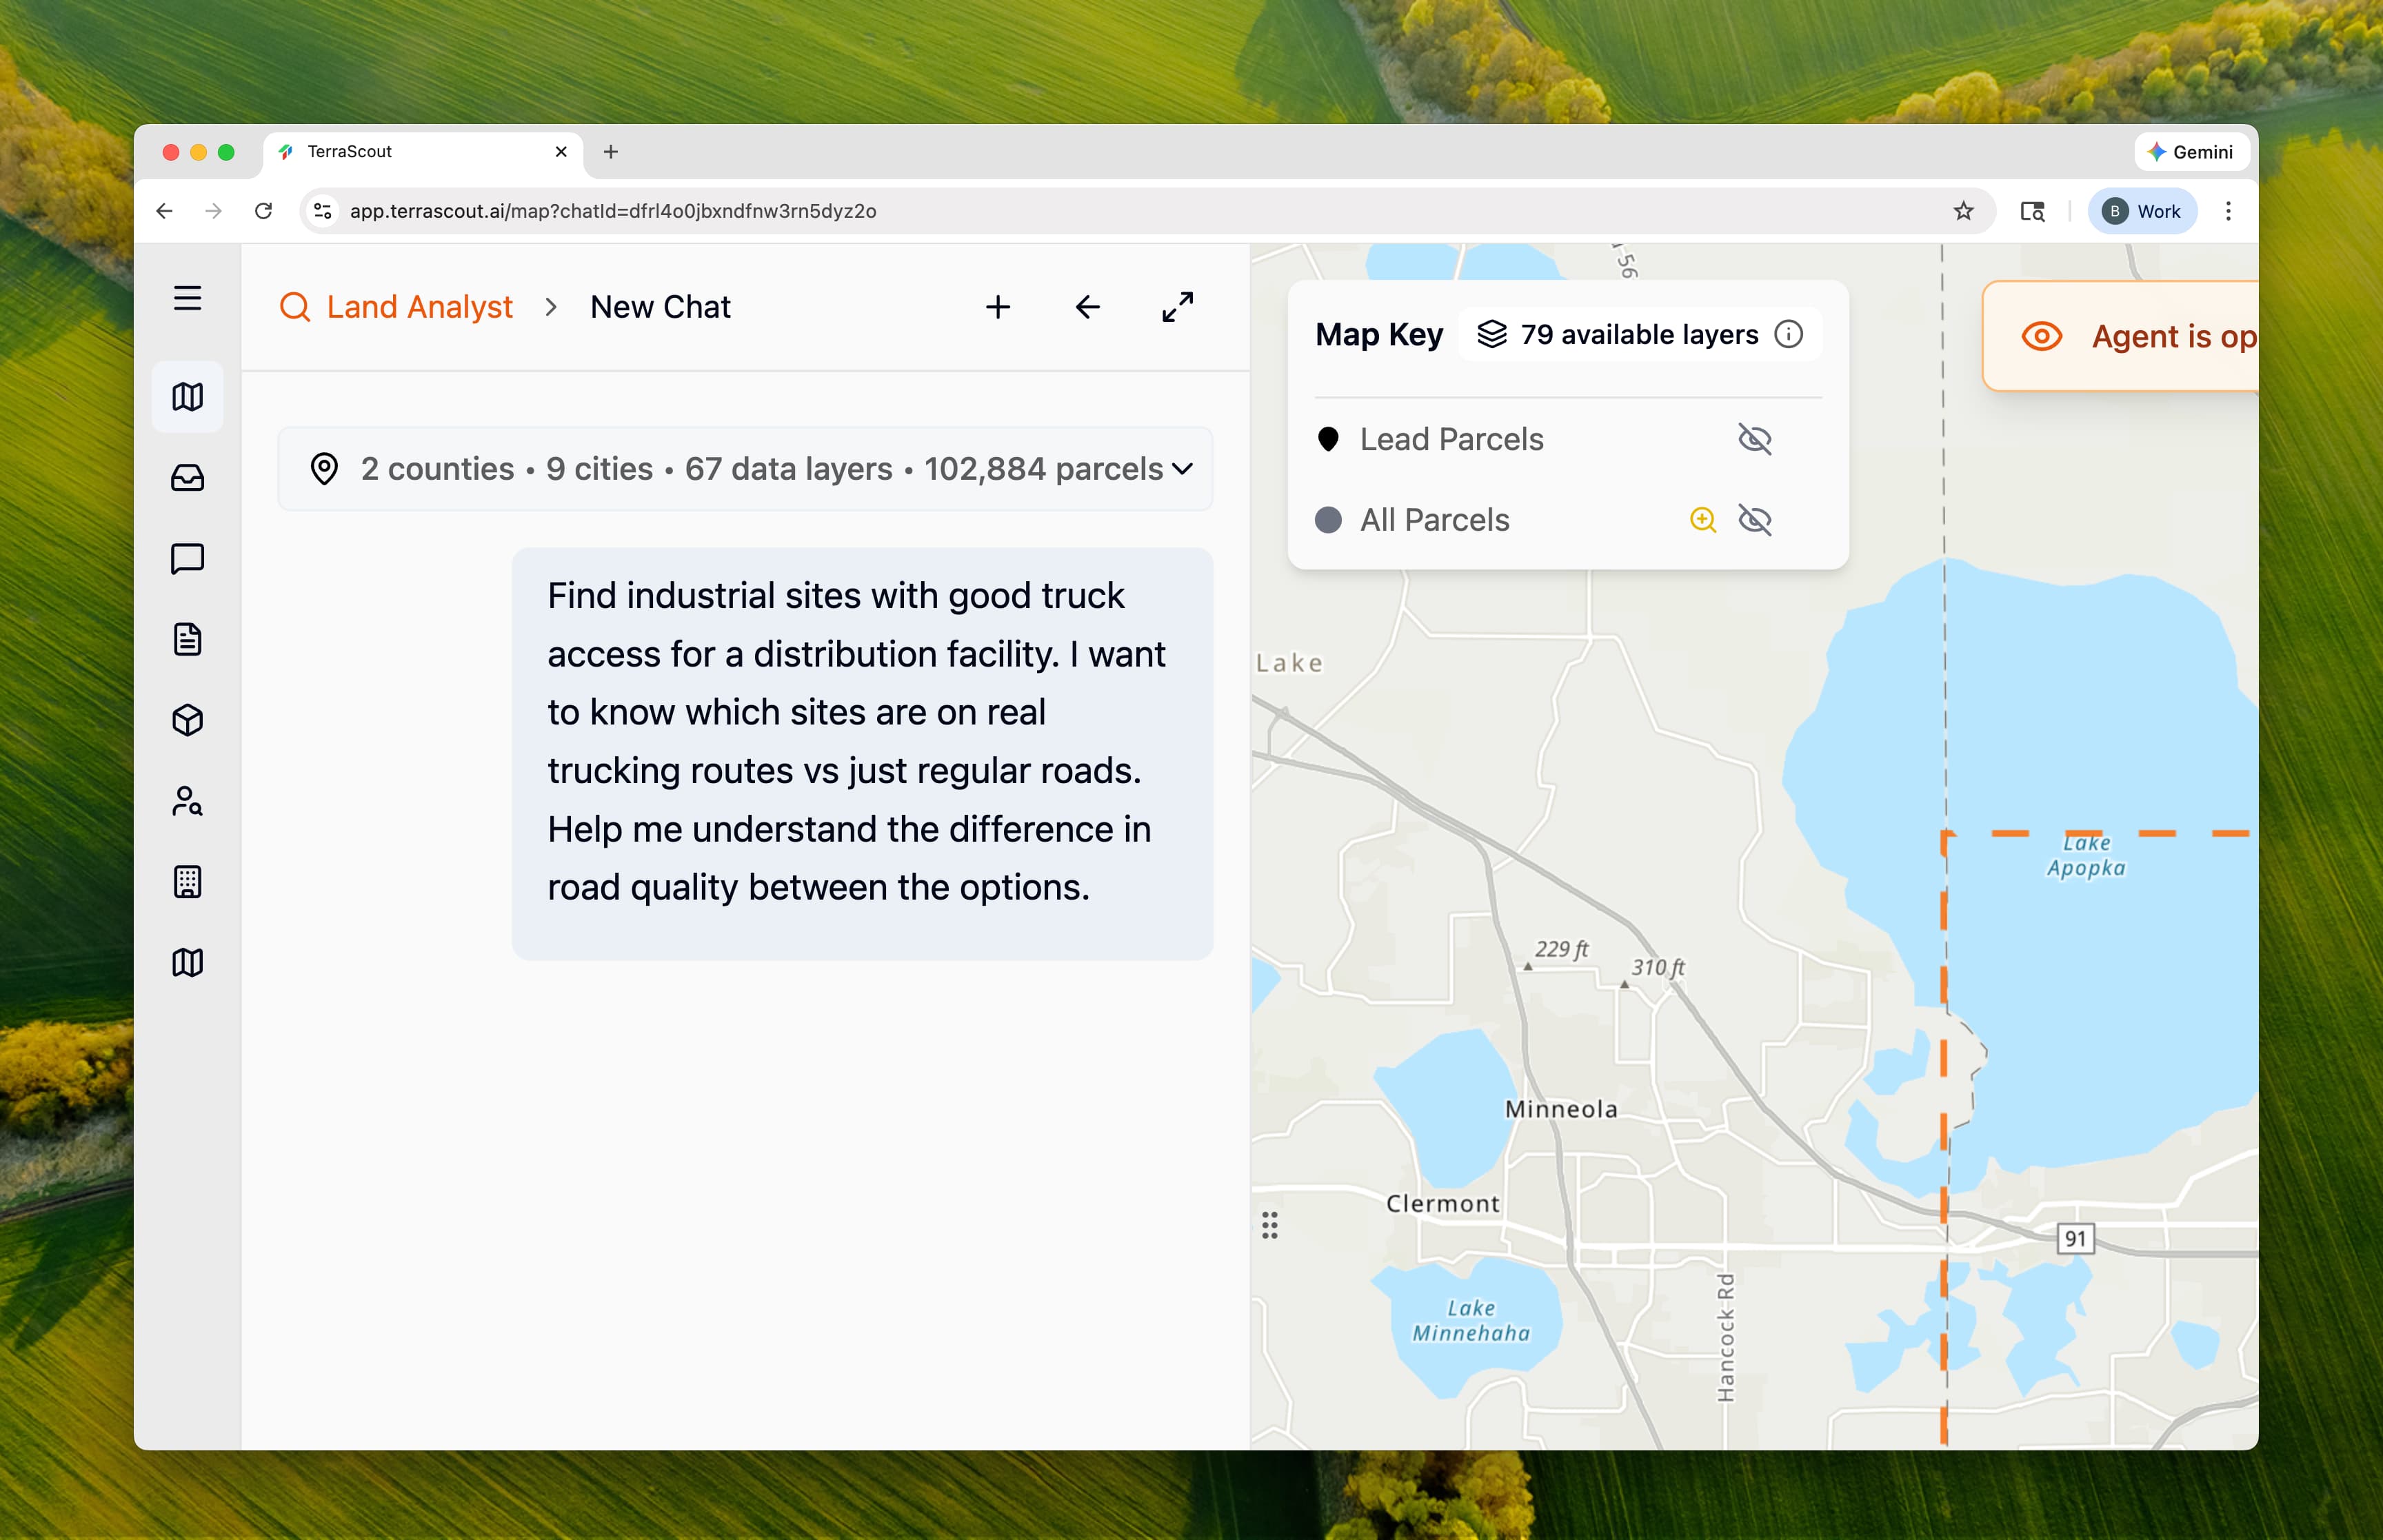
Find industrial sites with good truck access for a distribution facility. I want to know which sites are on real trucking routes vs just regular roads. Help me understand the difference in road quality between the options.Notice we didn’t mention “T-Factor” or “AADT” or any technical terms. We just asked about “good truck access” and “real trucking routes.” Ploti discovered the relevant data and translated our plain-language question into a sophisticated traffic analysis.
Step 3: Watch Ploti Discover the Data
Ploti found that FDOT traffic data includes truck_percentage_factor—the share of traffic that’s commercial trucks. This is the key to distinguishing freight corridors from regular roads:| Truck Percentage | What It Means | Example Roads |
|---|---|---|
| ≥10% | Major trucking corridor | SR 429, Florida Turnpike connectors |
| 5-10% | Commercial arterial | Typical business district roads |
| Under 5% | Primarily passenger traffic | Residential and local roads |
Step 4: Review the Plan
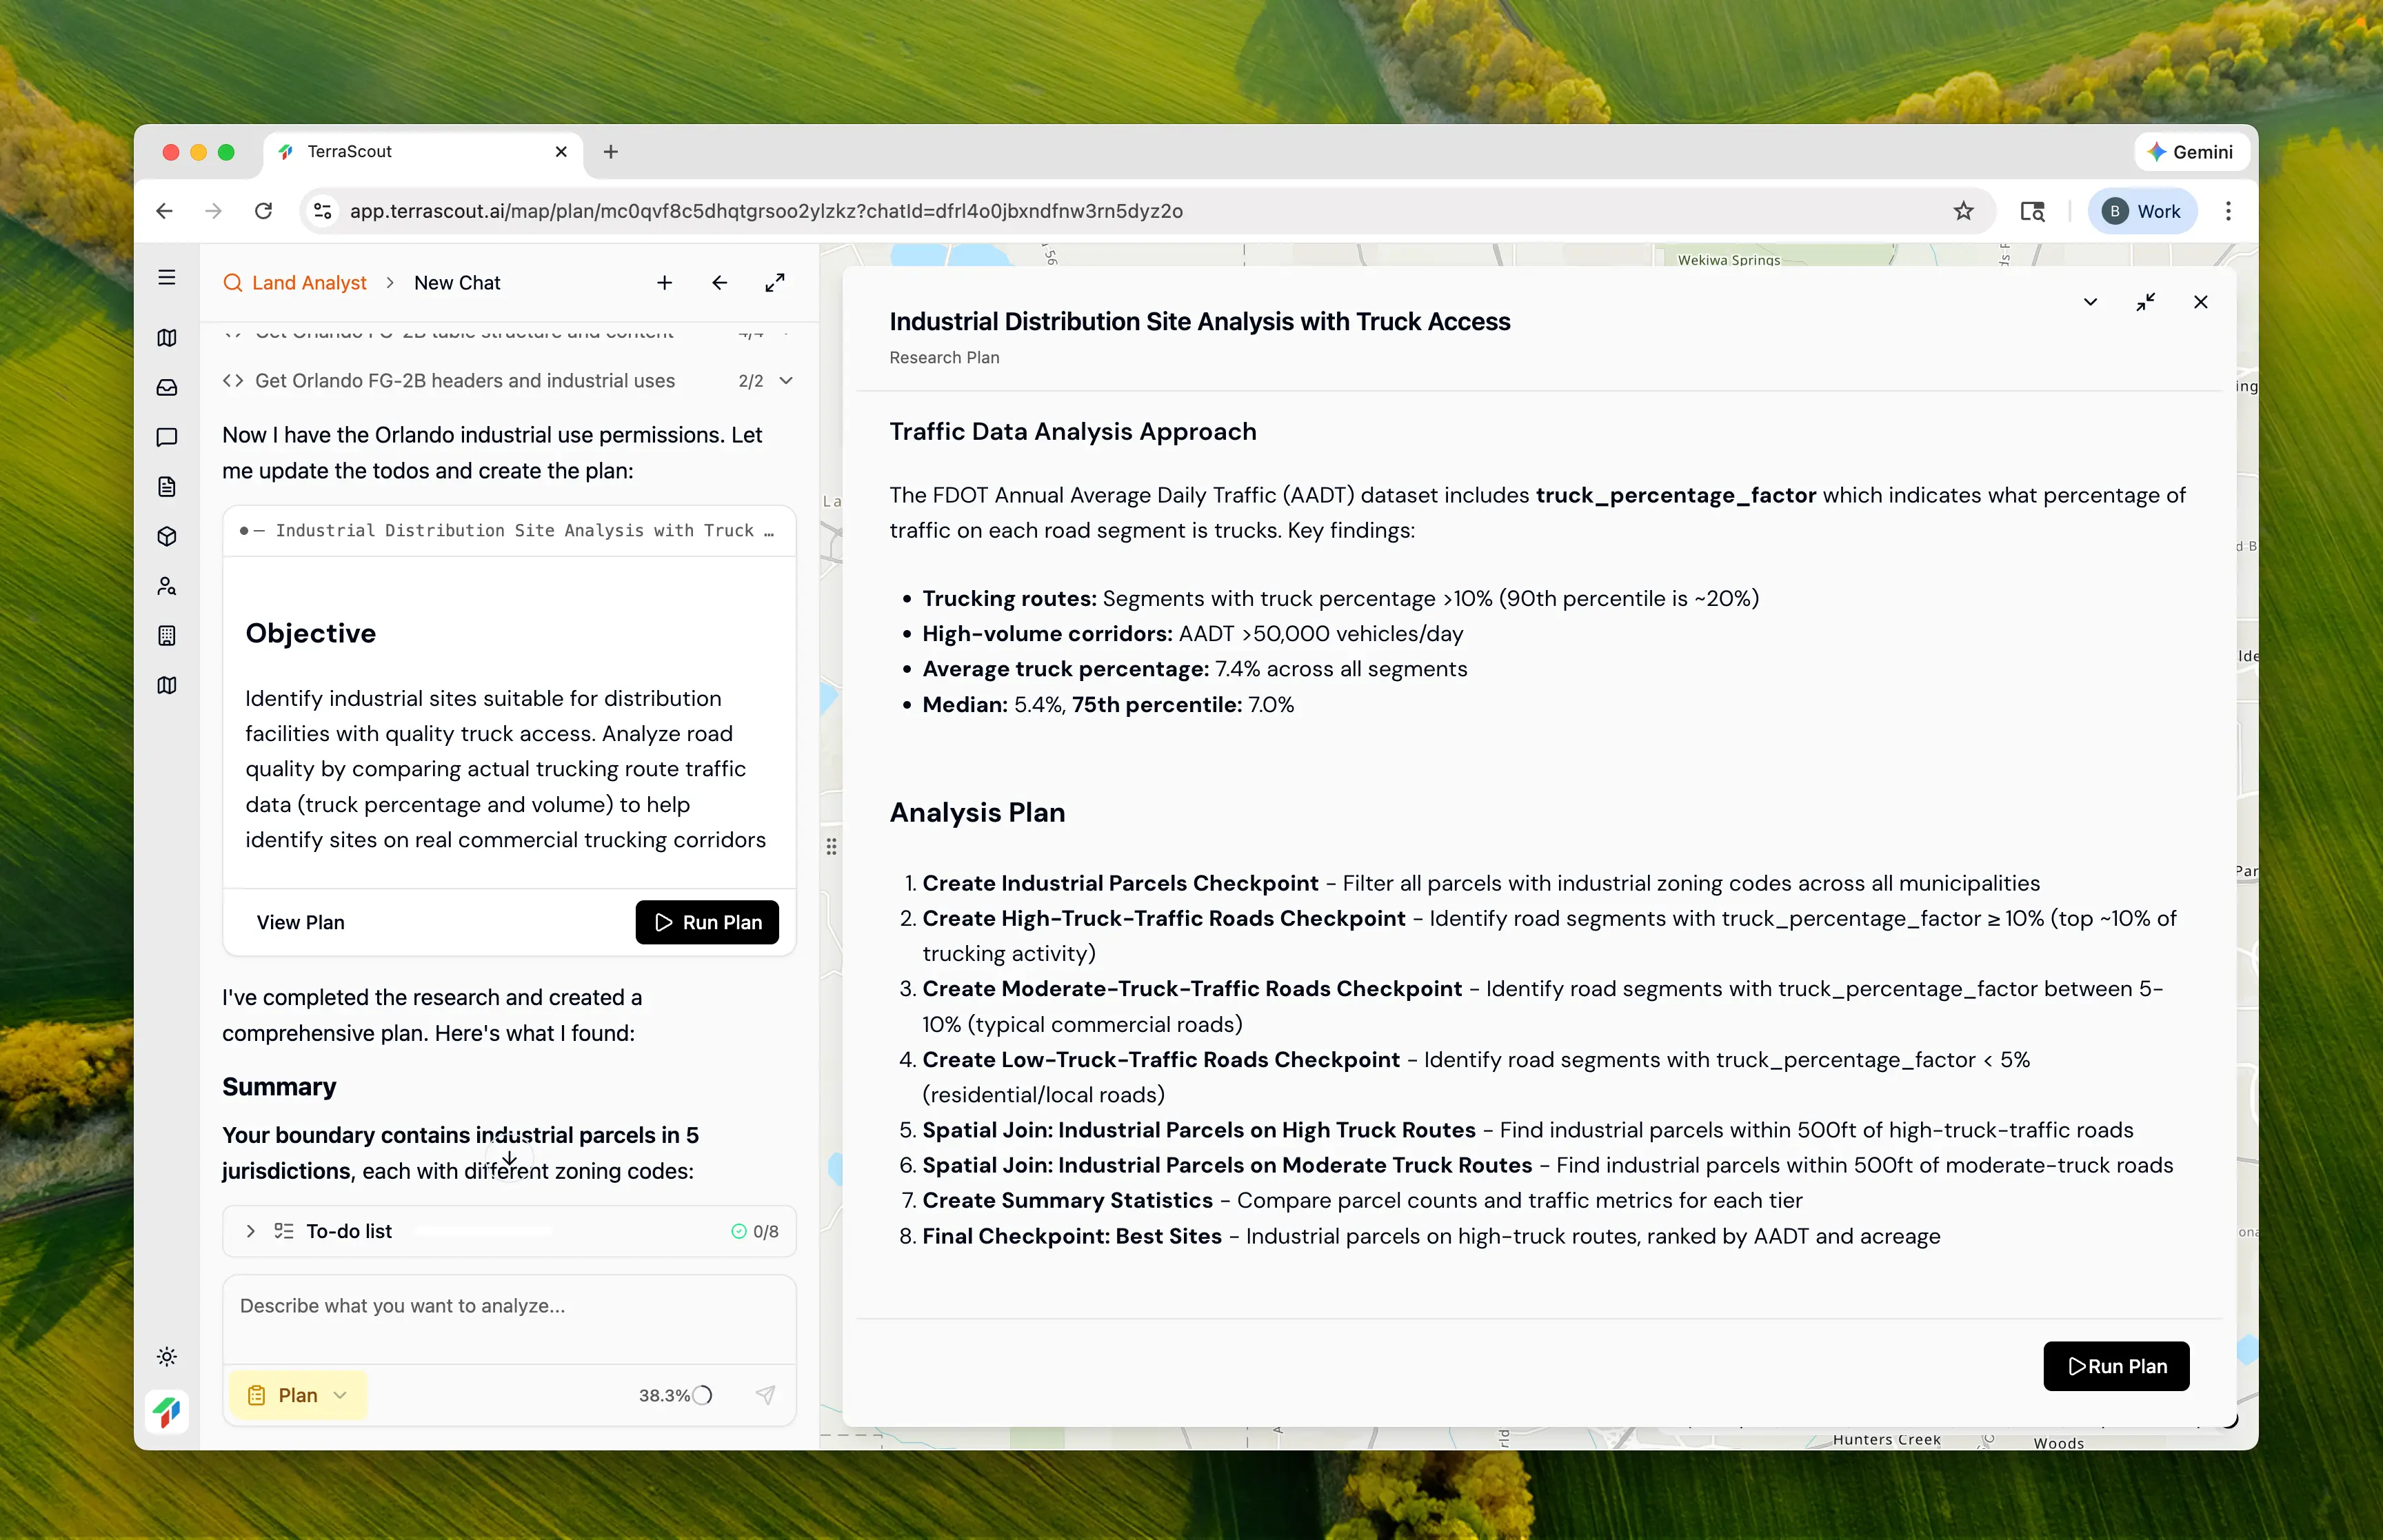
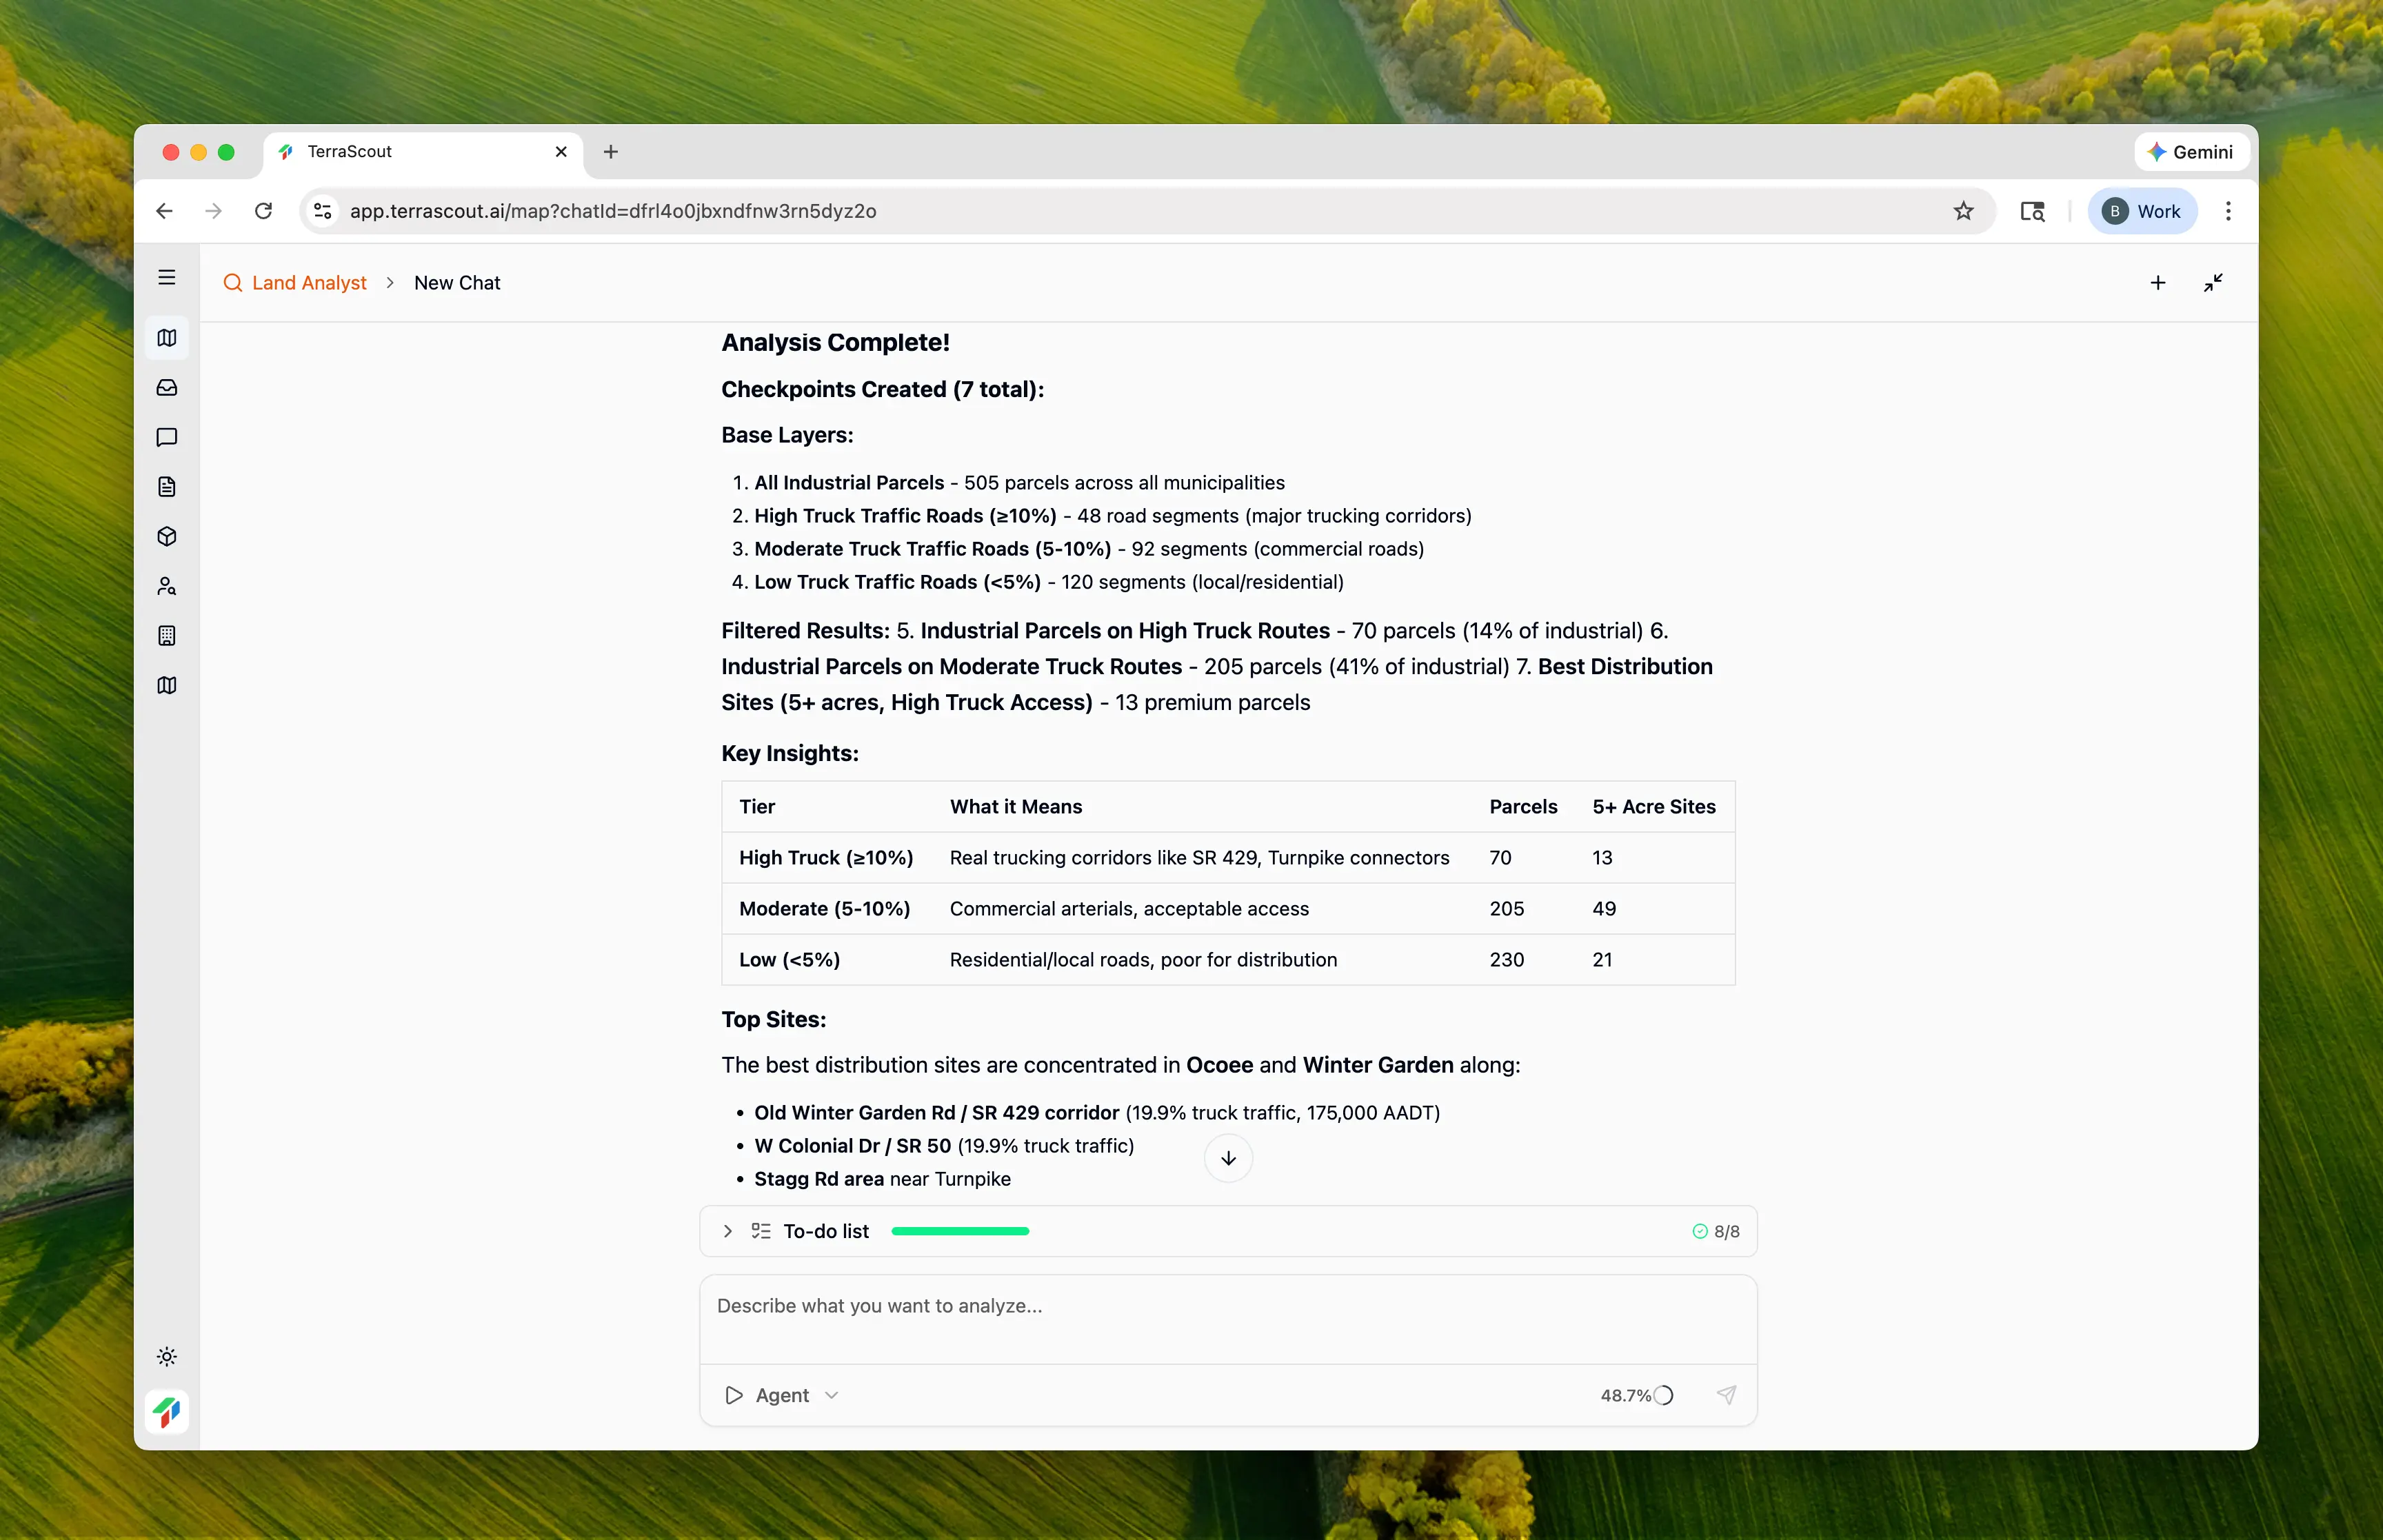
- Identify all industrial parcels (505 across 5 municipalities)
- Classify road segments into three tiers by truck percentage
- Spatial join: Find which parcels are within 500ft of each road tier
- Rank the best sites by acreage and traffic metrics
- Orange County Code § 38-77 — Warehousing/distribution permitted in I-1 through I-5
- Orlando Code FG-2B — Wholesale/Warehouse permitted in I-C, I-G, I-P
- Winter Garden Code § 118-727 — Warehousing/distribution permitted in I-1
- Ocoee Code § 6-14 — Commercial/Industrial development regulations
Step 5: Run the Analysis
Click Run Plan to execute. Ploti creates 7 checkpoints: Road Classification:| Tier | Truck Traffic | Segments | Description |
|---|---|---|---|
| High | ≥10% | 48 | Major trucking corridors |
| Moderate | 5-10% | 92 | Commercial arterials |
| Low | Under 5% | 120 | Residential/local roads |
| Category | Parcels | % of Total | 5+ Acre Sites |
|---|---|---|---|
| On High Truck Routes | 70 | 14% | 13 |
| On Moderate Truck Routes | 205 | 41% | 49 |
| Low/No Major Access | 230 | 45% | 21 |
Step 6: Review the Results
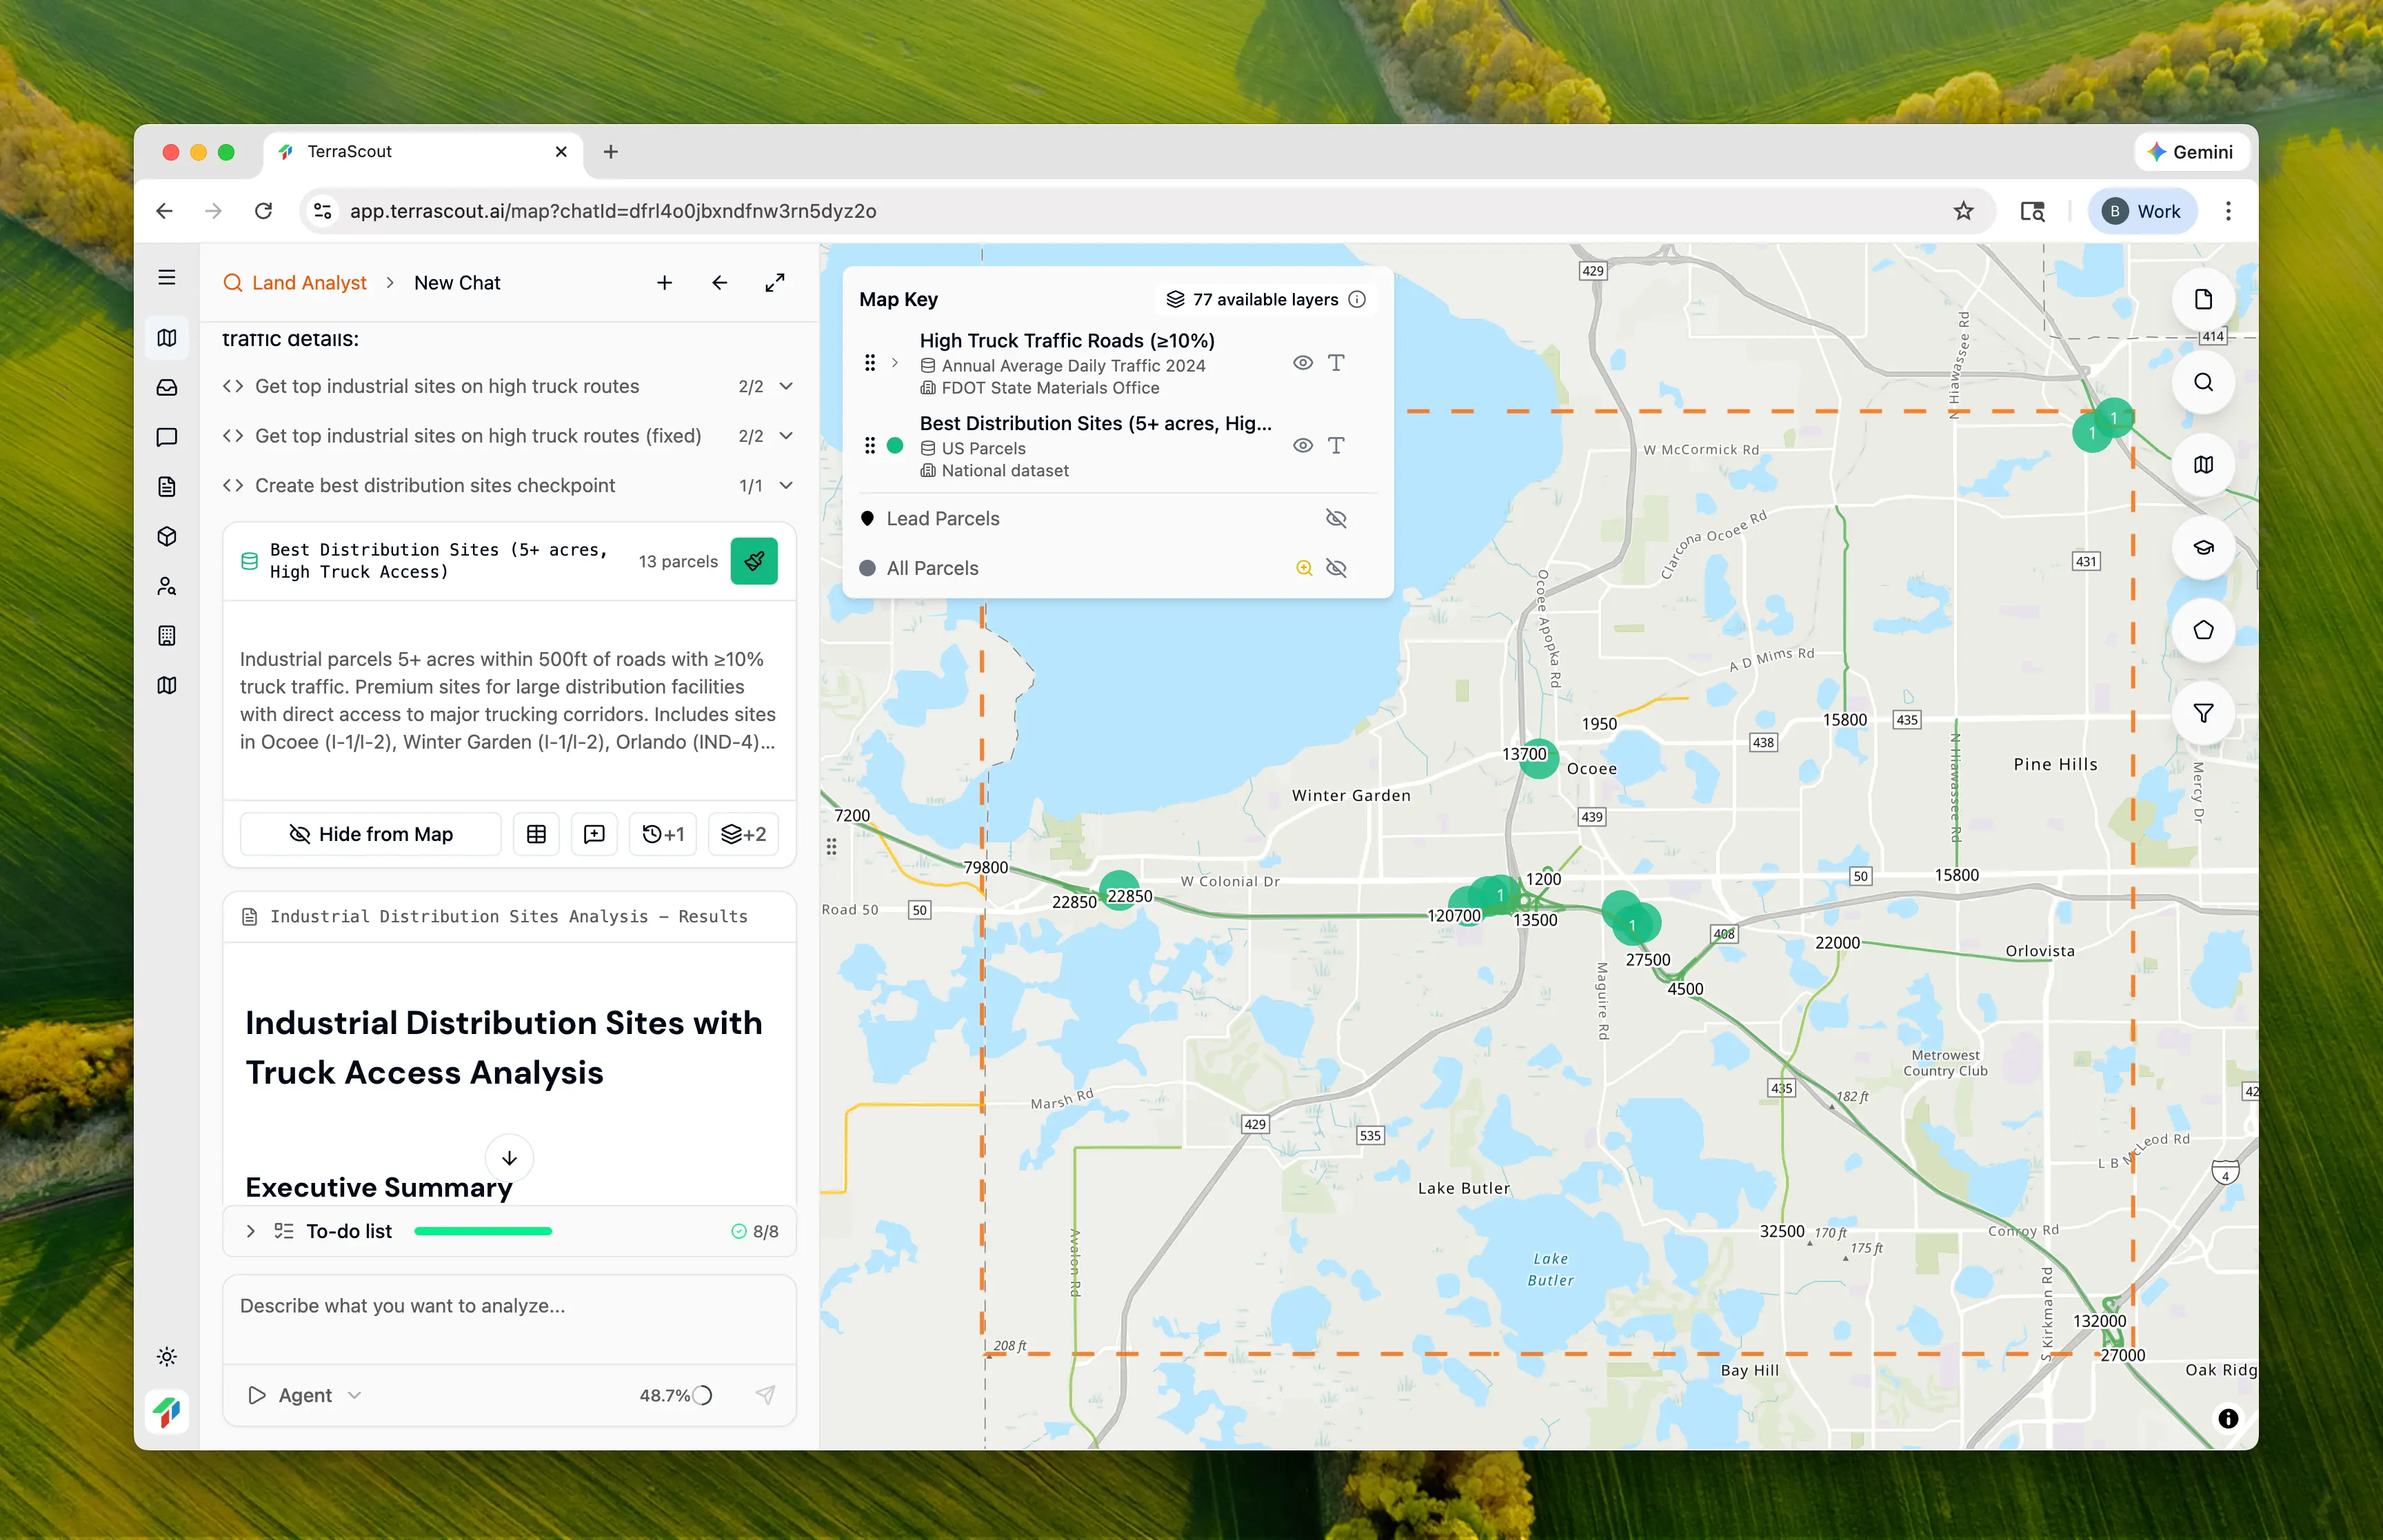
Step 7: Examine the Best Sites
| Acres | City | Zoning | AADT | Truck % | Address |
|---|---|---|---|---|---|
| 32.1 | Ocoee | I-1 | 175,000 | 19.9% | Old Winter Garden Rd |
| 25.9 | Winter Garden | I-2 | 97,500 | 19.9% | 1185 Elboc Way |
| 16.6 | Ocoee | I-1 | 175,000 | 19.9% | 2760 Southside Dr |
| 13.6 | Ocoee | I-1 | 175,000 | 19.9% | Old Winter Garden Rd |
| 12.1 | Winter Garden | I-1 | 97,500 | 19.9% | 12002 W Colonial Dr |
| 12.0 | Ocoee | I-1 | 13,700 | 12.8% | 710 Franklin St |
| 10.0 | Winter Garden | I-1 | 120,700 | 19.9% | 937 Stagg Rd |
Step 8: Understand the Traffic Metrics
- ≥10%: Road is a freight corridor. Infrastructure built for trucks. Neighbors expect truck traffic.
- 5-10%: Commercial road with regular truck use but not a primary freight route.
- Under 5%: Primarily passenger vehicles. May have weight restrictions or infrastructure issues.
- Higher AADT = busier road with more infrastructure investment
- Sites on high AADT + high truck % roads have the best logistics connectivity
Why This Matters
This analysis demonstrates data discovery and interpretation:- Plain language → technical analysis — Asked about “real trucking routes,” Ploti found and used truck percentage data
- Tiered classification — Didn’t just find “roads nearby” but classified them by actual freight usage
- Quantified “good access” — 19.9% truck traffic is objectively better than 3% for distribution
- Ranked results — Best sites floated to the top based on actual traffic data
- Market insight — Only 14% of industrial parcels have premium truck access
- Obtaining FDOT traffic count data
- Understanding which fields matter (T-Factor vs raw AADT)
- Performing spatial joins between parcels and road segments
- Manually classifying roads into tiers
- Cross-referencing with zoning for permitted uses
Taking It Further
With truck access tiers established, you can refine further:Which of the high truck access sites are also outside flood zones?Layer in environmental screening.
Show me the moderate truck route sites that are larger than 10 acresFind alternatives if premium sites are unavailable.
What’s the zoning difference between I-1 and I-2 in Ocoee?Research development standards for the top sites.
Who owns the 32-acre site on Old Winter Garden Rd?Get owner details for outreach.
Key Insights
Why Truck Percentage Matters More Than AADT
A road with 100,000 AADT sounds impressive, but if only 2% is trucks, it’s a commuter route—not a freight corridor. Conversely, a road with 20,000 AADT and 15% trucks (3,000 trucks/day) is a real logistics artery. Truck percentage tells you:- Whether the road is engineered for heavy vehicles
- Whether neighbors expect truck traffic (fewer complaints)
- Whether you’re connecting to regional freight networks
The SR 429 Corridor
The analysis revealed that the SR 429 / Old Winter Garden Rd area in Ocoee has the best truck access in the boundary:- 19.9% truck traffic (top tier)
- 175,000 AADT (major highway)
- Multiple 10+ acre industrial sites available
- I-1 zoning permits warehousing/distribution
The 14% Premium
Only 14% of industrial parcels have access to high truck traffic roads. This scarcity makes these sites more valuable—and means developers should act quickly when they become available.Tips
- Truck percentage beats proximity — Being 500ft from a 20% truck road is better than being adjacent to a 3% truck road
- Check both metrics — High AADT + High truck % = best connectivity
- Verify access points — Parcel may be “near” a highway but lack actual access
- Consider turn movements — High-volume roads may have restricted left turns
- Think about employees too — Great truck access doesn’t help if workers can’t commute there
- 19-20% is exceptional — Most roads are under 10%; anything above is a true freight corridor
Other Example Prompts
Avoiding Residential Conflicts
Find industrial sites on roads with high truck traffic but away from residential areasDistribution facilities on freight corridors with buffer from neighbors.
Last-Mile vs Regional Distribution
Compare sites suitable for last-mile delivery (closer to population) vs regional distribution (highway access priority)Different truck access needs for different operations.
Traffic Congestion Analysis
Which industrial sites have high AADT but might face congestion? Show me truck percentage relative to total traffic.Identify roads that might be busy but not truck-friendly.
Interchange Proximity
Find industrial sites within 2 miles of highway interchanges with the highest truck trafficPremium sites near on/off ramps to major freight routes.
Multi-Modal Access
Find industrial sites near both high truck routes and the airportSites with truck and air freight options.