
From completed research to an interactive workspace
The research request page is the permanent home for the assignment. It shows the request status, completed summary, research activity, linked data requests, and the artifacts produced by the run.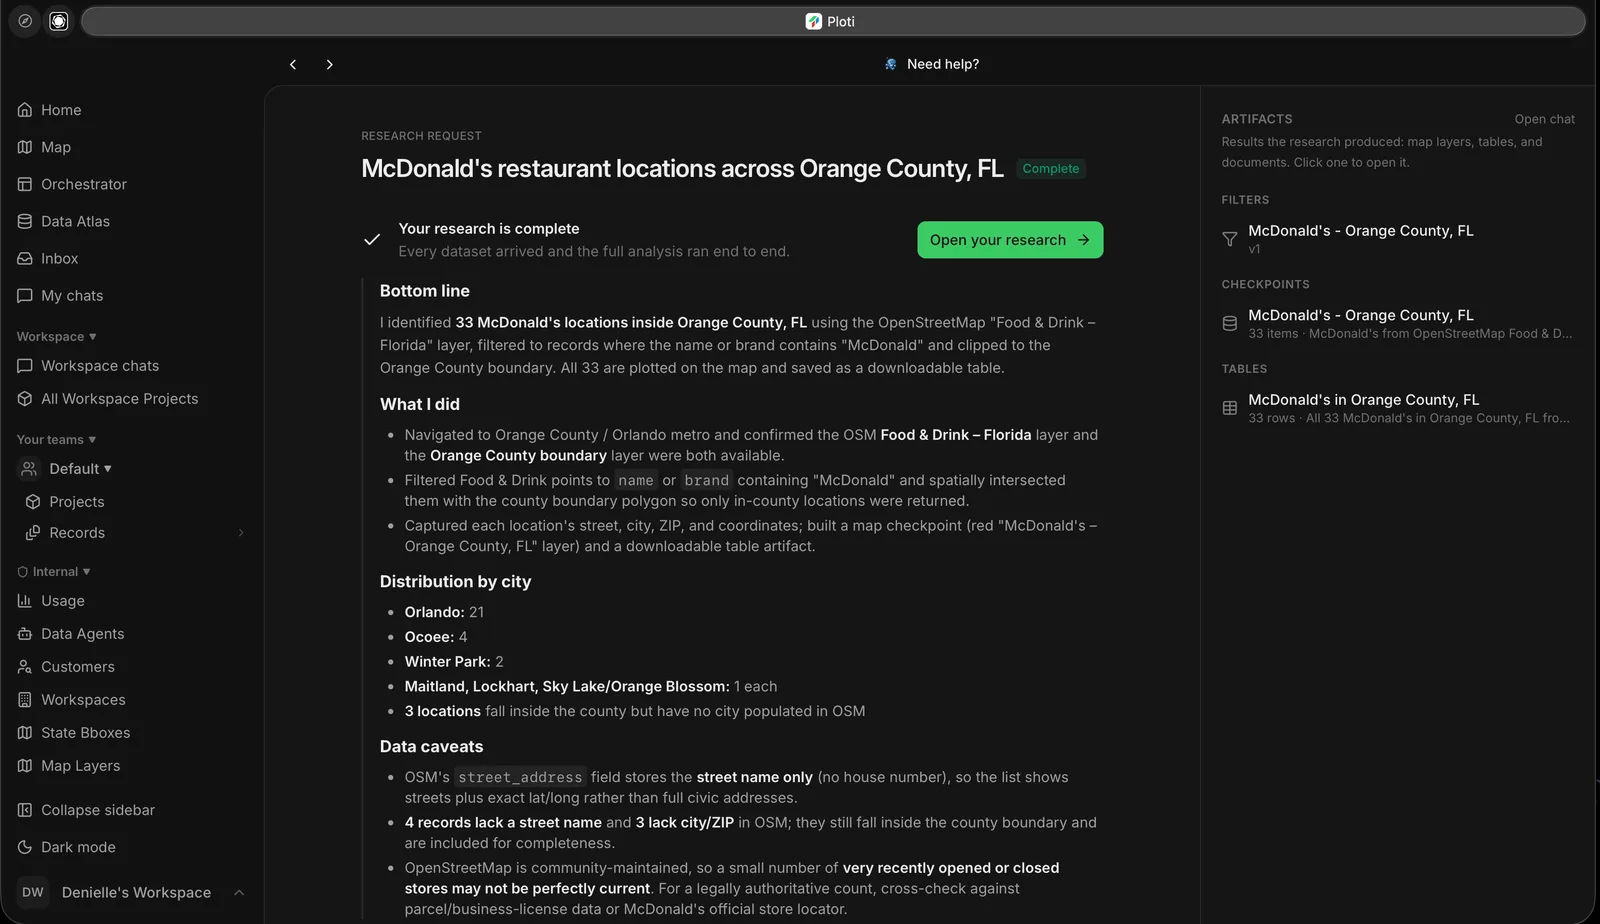
A completed Orange County research request with its summary, caveats, filter, checkpoint, and table.
Artifact types
Use the map as the analysis surface
Mapped outputs open on the map with the source research chat available. From there you can:- Toggle and reorder research layers
- Change colors, opacity, and display fields
- Inspect an individual parcel or feature
- Compare a result with workspace datasets
- Open a checkpoint or table
- Continue the analysis in chat
- Export data or save important findings as records
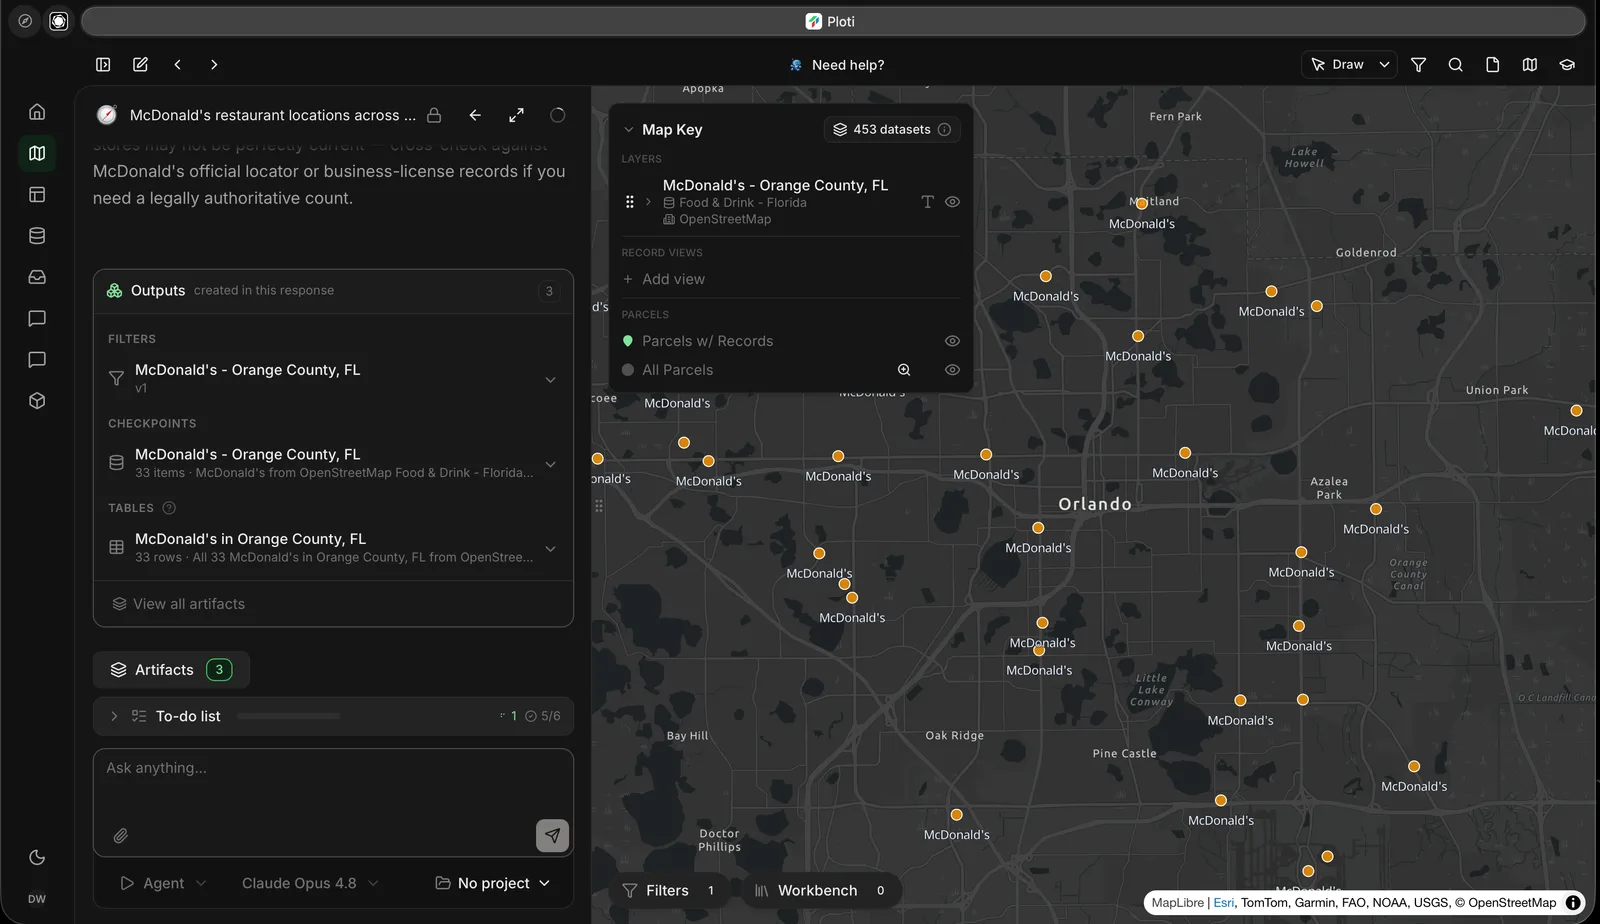
A completed research result mapped across Orange County with its artifacts and map key available for inspection.
The map is downstream, but still interactive
You no longer need to begin by choosing a map mode or drawing a boundary. Start with the request. Use the map when spatial context, feature-level inspection, comparison, or refinement becomes valuable.Next step
Continue the research
Ask follow-up questions and turn findings into reusable workspace data.