> ## Documentation Index
> Fetch the complete documentation index at: https://terrascout.ai/docs/llms.txt
> Use this file to discover all available pages before exploring further.
# Results and map
> Open completed research artifacts and continue working with them in Ploti's map workspace
# From completed research to an interactive workspace
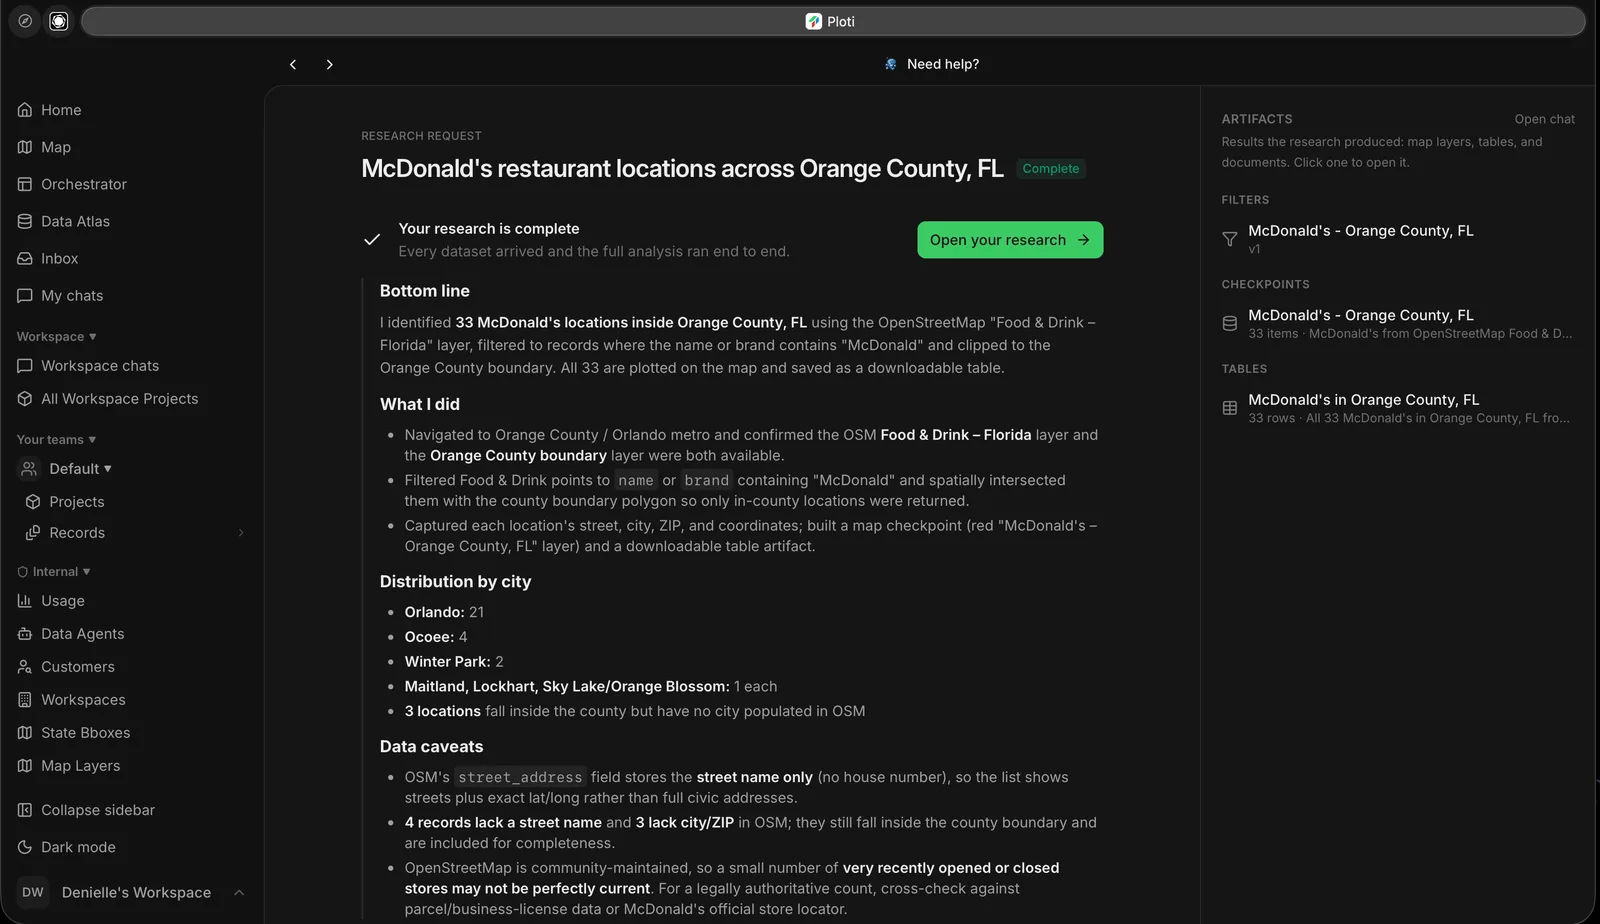
The research request page is the permanent home for the assignment. It shows the request status, completed summary, research activity, linked data requests, and the artifacts produced by the run.
 ## Artifact types
| Result | What it is | What happens when you open it |
| --------------- | ------------------------------------------- | -------------------------------------------------------- |
| **Filter** | A live set of criteria applied to a dataset | Opens the research chat or mapped result context |
| **Checkpoint** | A durable snapshot of matching records | Adds the result as a map layer and focuses the map |
| **Table** | Materialized rows and selected columns | Opens a tabular result that can be inspected or exported |
| **Saved query** | A reusable query definition | Opens the saved result in the map workspace |
| **Document** | A research memo or structured narrative | Opens the document view |
| **Plan** | A preserved analysis plan | Opens the plan document |
| **File** | A generated download | Opens from the research chat or file action |
## Use the map as the analysis surface
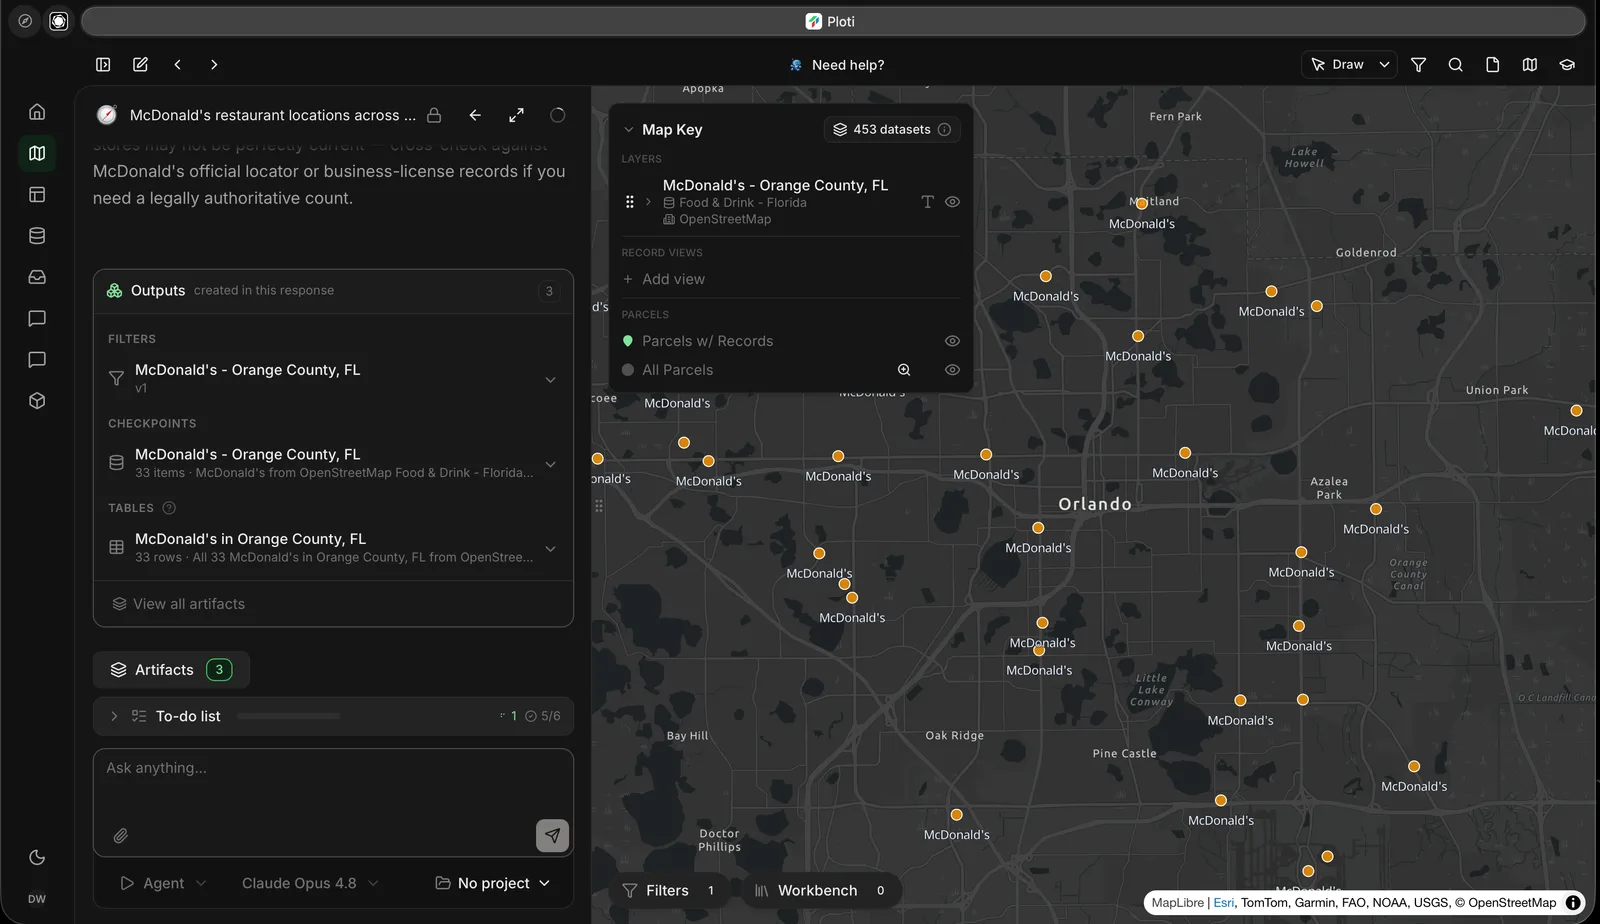
Mapped outputs open on the map with the source research chat available. From there you can:
* Toggle and reorder research layers
* Change colors, opacity, and display fields
* Inspect an individual parcel or feature
* Compare a result with workspace datasets
* Open a checkpoint or table
* Continue the analysis in chat
* Export data or save important findings as records
## Artifact types
| Result | What it is | What happens when you open it |
| --------------- | ------------------------------------------- | -------------------------------------------------------- |
| **Filter** | A live set of criteria applied to a dataset | Opens the research chat or mapped result context |
| **Checkpoint** | A durable snapshot of matching records | Adds the result as a map layer and focuses the map |
| **Table** | Materialized rows and selected columns | Opens a tabular result that can be inspected or exported |
| **Saved query** | A reusable query definition | Opens the saved result in the map workspace |
| **Document** | A research memo or structured narrative | Opens the document view |
| **Plan** | A preserved analysis plan | Opens the plan document |
| **File** | A generated download | Opens from the research chat or file action |
## Use the map as the analysis surface
Mapped outputs open on the map with the source research chat available. From there you can:
* Toggle and reorder research layers
* Change colors, opacity, and display fields
* Inspect an individual parcel or feature
* Compare a result with workspace datasets
* Open a checkpoint or table
* Continue the analysis in chat
* Export data or save important findings as records
 ## The map is downstream, but still interactive
You no longer need to begin by choosing a map mode or drawing a boundary. Start with the request. Use the map when spatial context, feature-level inspection, comparison, or refinement becomes valuable.
## Next step
Ask follow-up questions and turn findings into reusable workspace data.
## The map is downstream, but still interactive
You no longer need to begin by choosing a map mode or drawing a boundary. Start with the request. Use the map when spatial context, feature-level inspection, comparison, or refinement becomes valuable.
## Next step
Ask follow-up questions and turn findings into reusable workspace data.